Fig. 6.
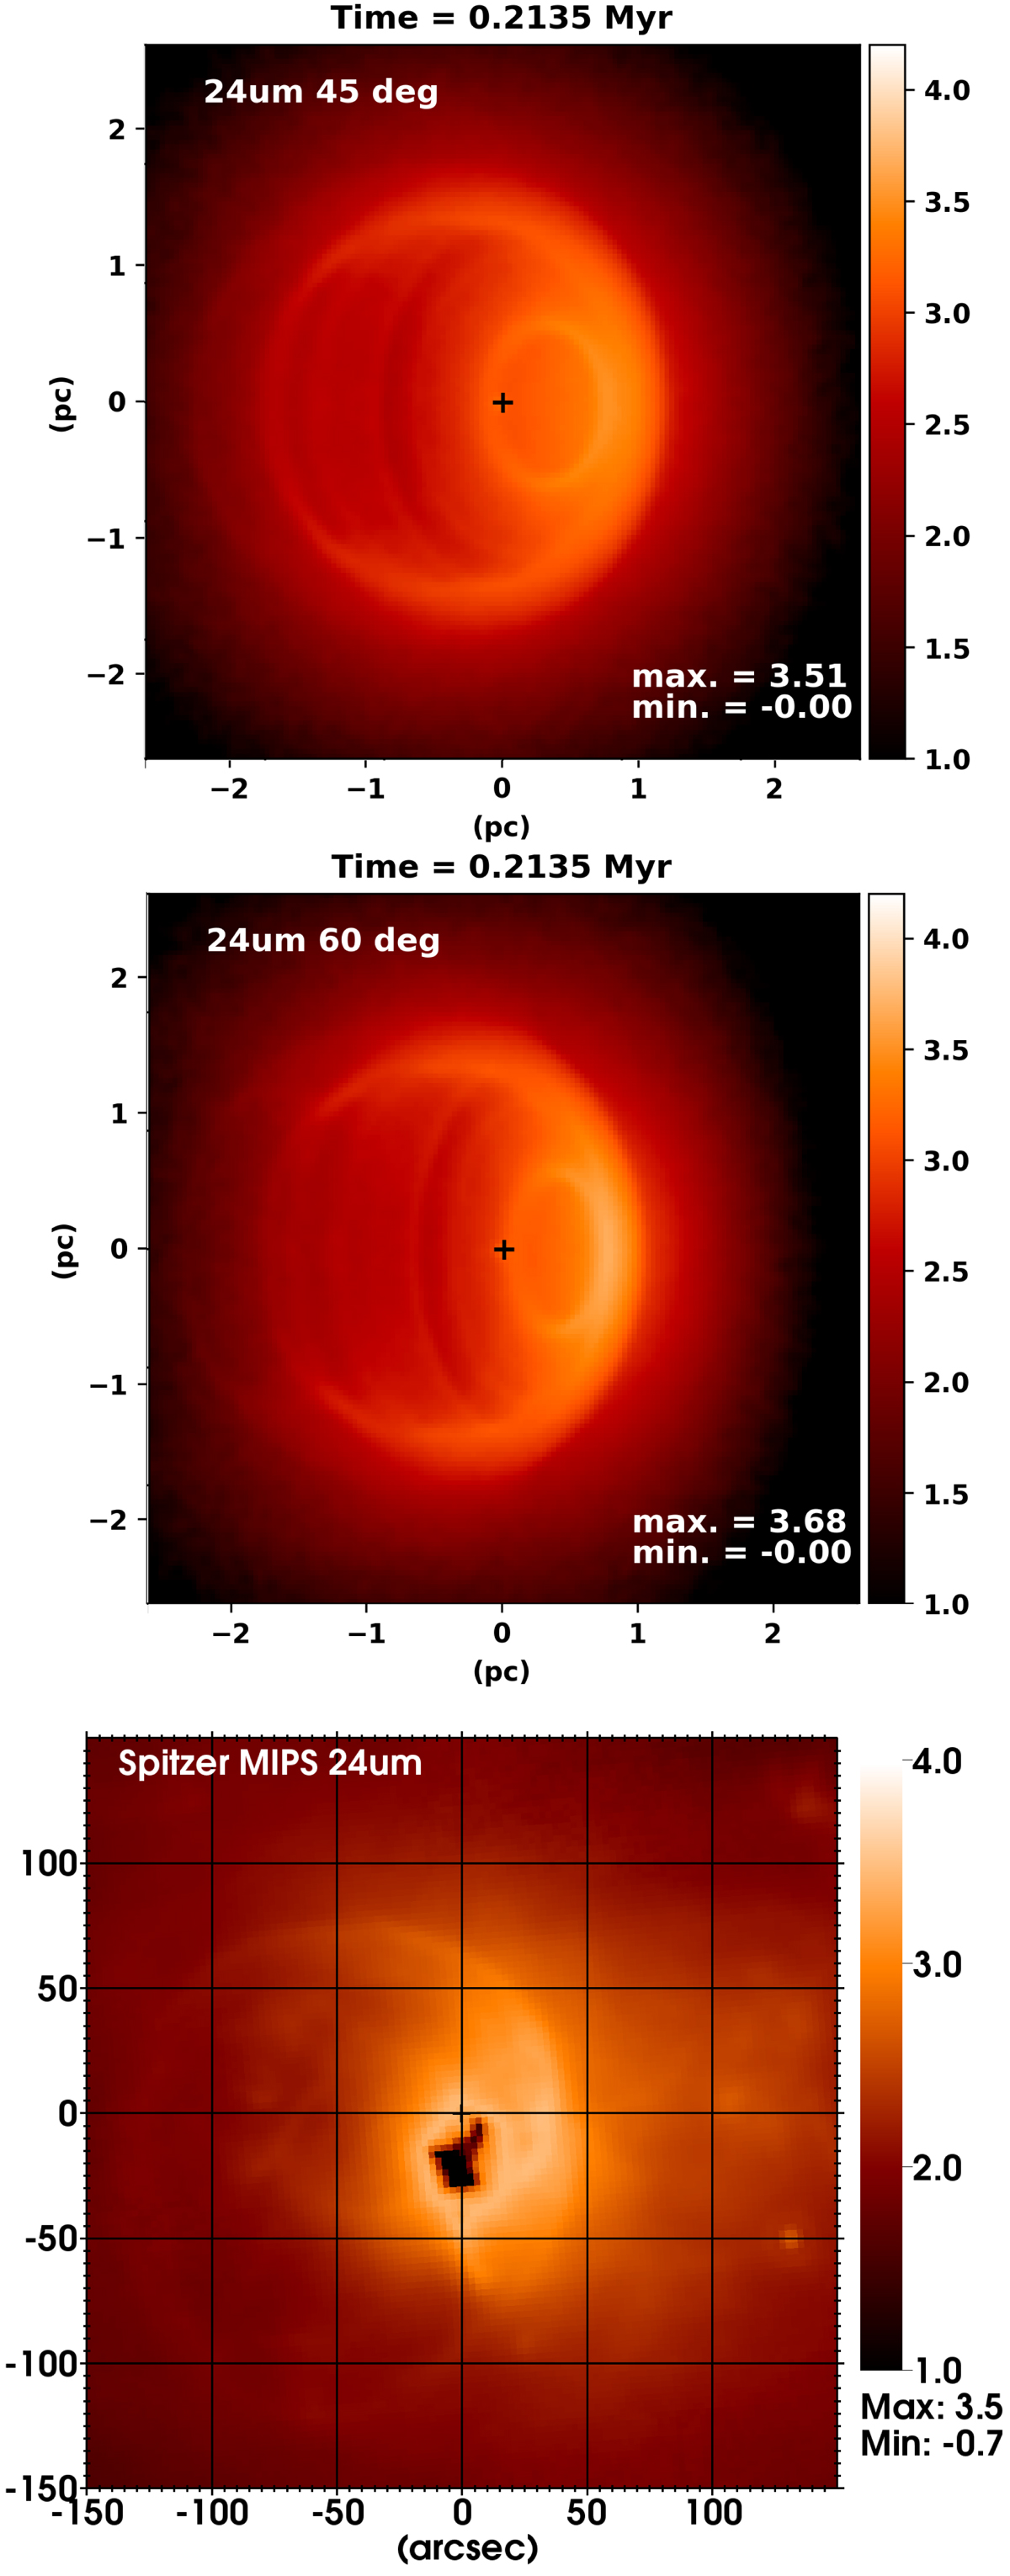
Top two images: synthetic infrared emission maps of the bow shock on a logarithmic colour scale (in units of MJy ster−1), generated from the 1b simulation for viewing angle angles of 45° and 60°. Both synthetic images are generated after 0.2135 Myr of evolution and smoothed to the angular resolution of Spitzer of 6 arcsec. The coordinates are in parsecs relative to the position of the star. The black cross shows the position of the ionizing star. Bottom plot: Spitzer 24 μm image of the Bubble Nebula.
Current usage metrics show cumulative count of Article Views (full-text article views including HTML views, PDF and ePub downloads, according to the available data) and Abstracts Views on Vision4Press platform.
Data correspond to usage on the plateform after 2015. The current usage metrics is available 48-96 hours after online publication and is updated daily on week days.
Initial download of the metrics may take a while.