Fig. 2.
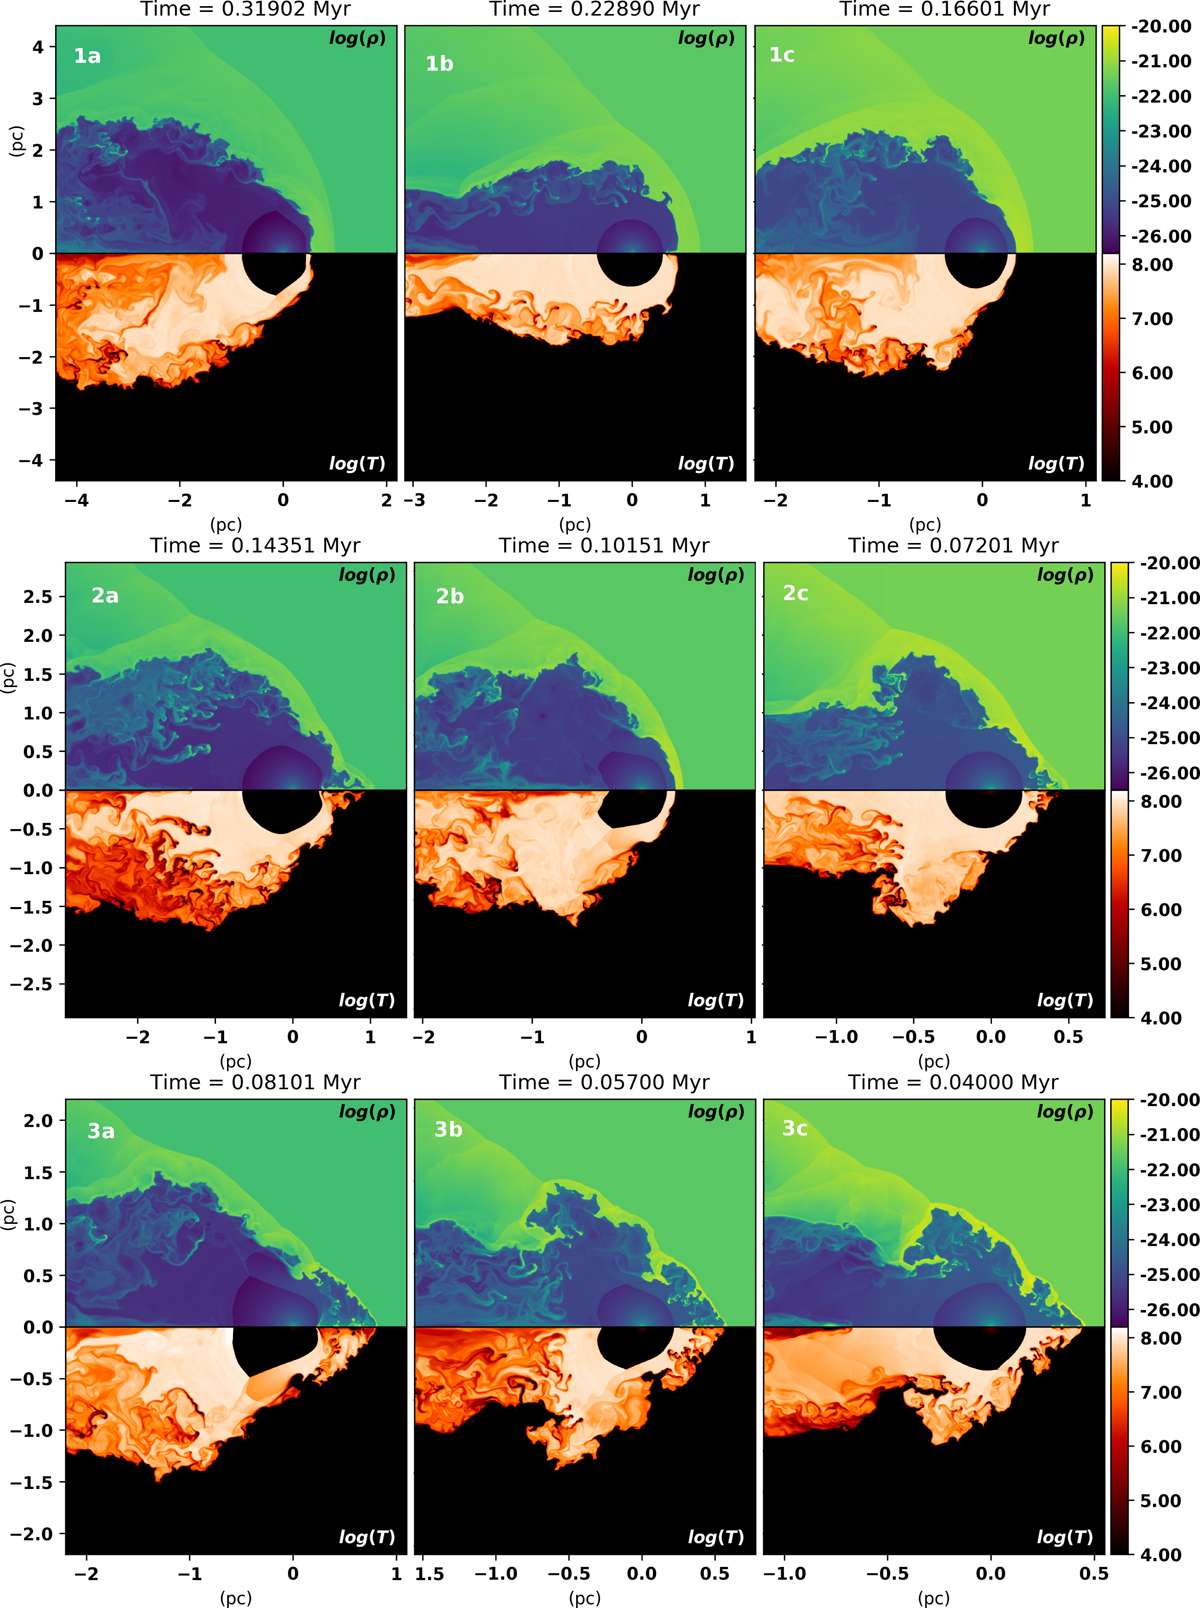
From left to right: snapshot after one crossing time from each simulation in Table 2. The top half shows log10 plots of the gas density (g cm−3) profile of the gas, and the bottom half shows log10 plots of the temperature profile of the gas with white being of higher temperature (K) than black. The star is at the origin. Labels of the different models are shown in white on each panel.
Current usage metrics show cumulative count of Article Views (full-text article views including HTML views, PDF and ePub downloads, according to the available data) and Abstracts Views on Vision4Press platform.
Data correspond to usage on the plateform after 2015. The current usage metrics is available 48-96 hours after online publication and is updated daily on week days.
Initial download of the metrics may take a while.