Fig. 14.
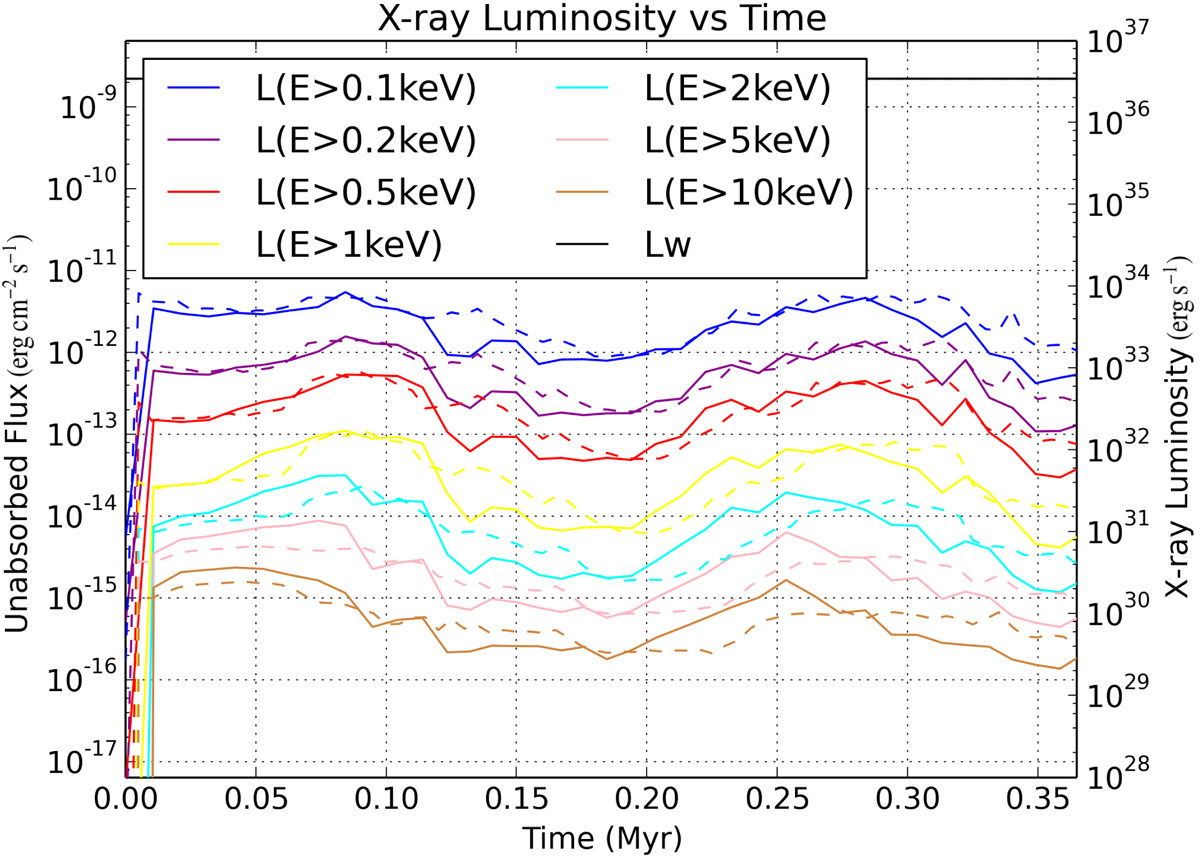
Synthetic X-ray unabsorbed flux (erg cm−2 s−1) and luminosity (erg s−1) plot of the Bubble Nebula as it evolves in time (Myr). Seven X-ray bands simulated from soft to hard X-rays, including 0.1 keV, 0.2 keV, 0.5 keV, 1 keV, 2 keV, 5 keV, and 10 keV. Solid lines are from the 1b simulation discussed in this paper, dashed lines are from a lower-resolution (Nzones = 768 × 512) simulation. Mechanical luminosity of the stellar wind (i.e. energy input rate to the wind bubble) is Lw = 3.6 × 1036 erg s−1 (seen as the black line in both plots).
Current usage metrics show cumulative count of Article Views (full-text article views including HTML views, PDF and ePub downloads, according to the available data) and Abstracts Views on Vision4Press platform.
Data correspond to usage on the plateform after 2015. The current usage metrics is available 48-96 hours after online publication and is updated daily on week days.
Initial download of the metrics may take a while.