Fig. C.3.
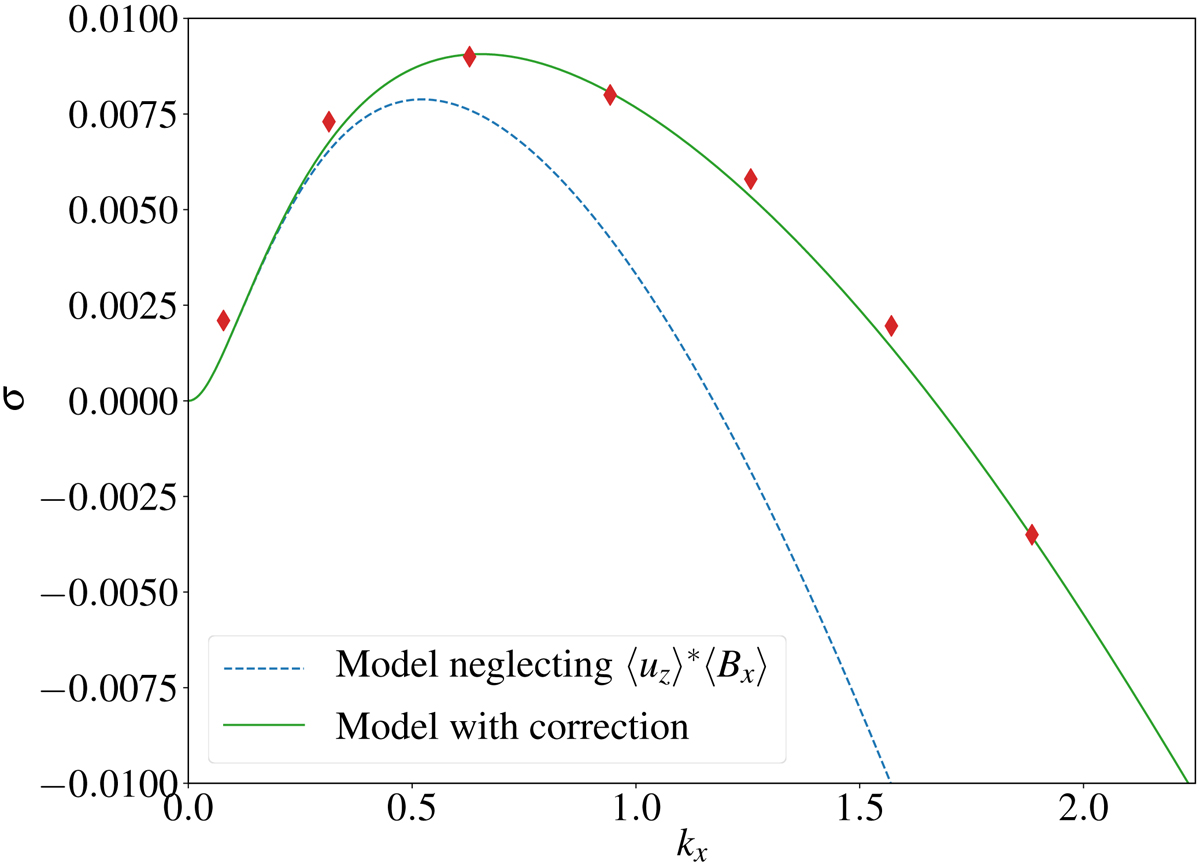
Growth rate of axismmyetric modes measured in the laminar-wind simulations for different kx (red diamond makers). The blue-dashed curve shows the theoretical growth rate predicted from the model extension in Appendix B (assuming a pure laminar stress). The green plain curve shows the same model but taking into account the uzBx term in the induction equation (this term is simply estimated by calculating the ratio uzBx/uxBz associated with the unstable mode in simulations.
Current usage metrics show cumulative count of Article Views (full-text article views including HTML views, PDF and ePub downloads, according to the available data) and Abstracts Views on Vision4Press platform.
Data correspond to usage on the plateform after 2015. The current usage metrics is available 48-96 hours after online publication and is updated daily on week days.
Initial download of the metrics may take a while.