Fig. 2.
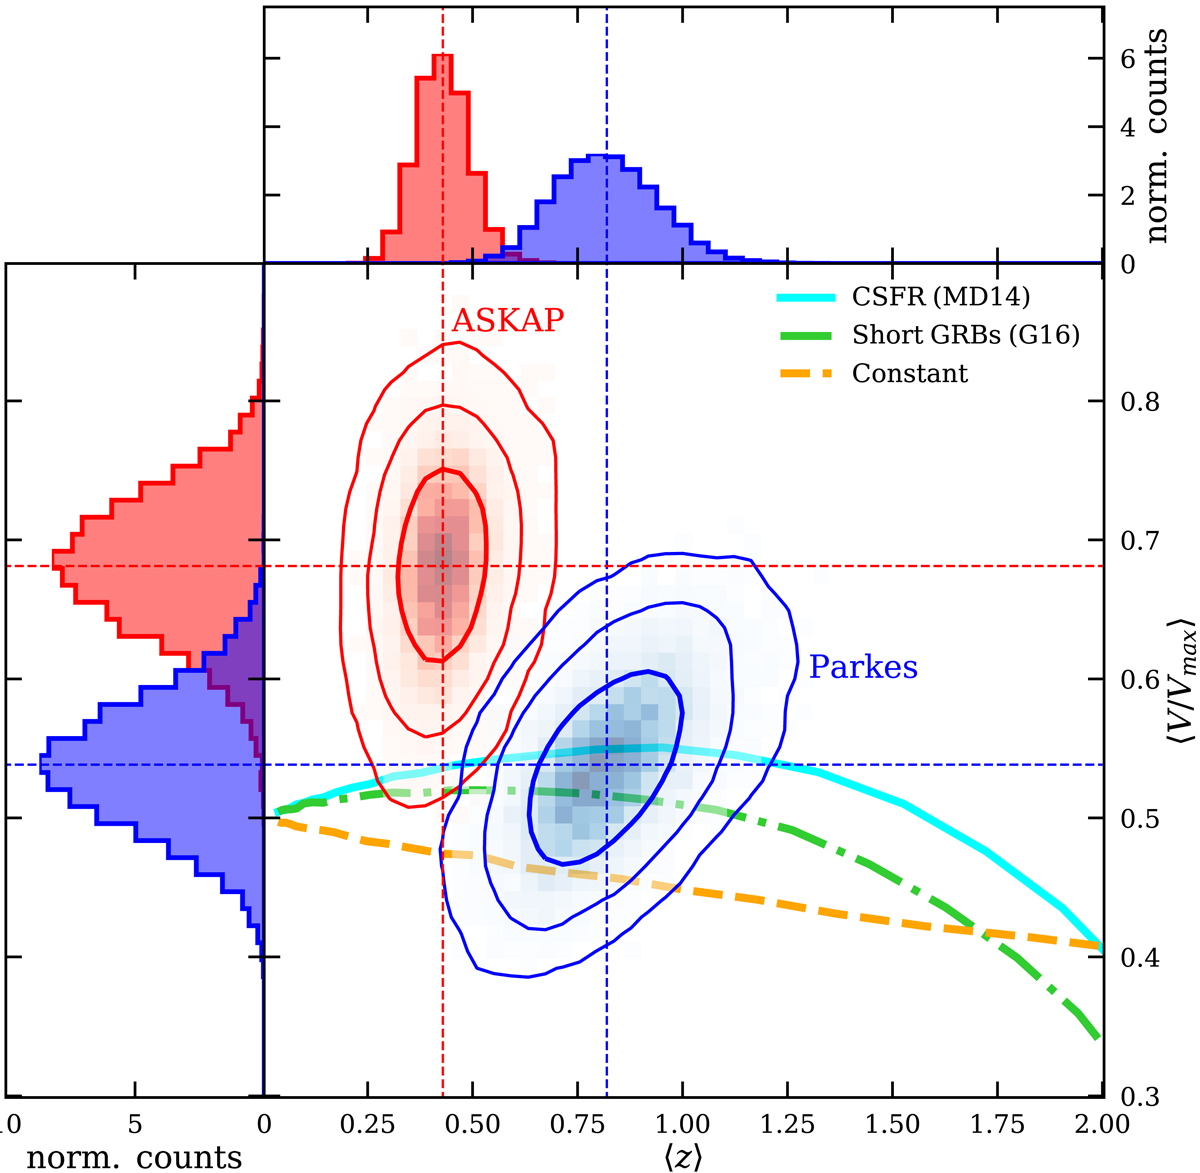
⟨V/Vmax⟩ of the ASKAP and Parkes FRB samples (red and blue squares, respectively) computed accounting for the cosmological terms (K-correction and rate) and the redshifts dispersion. Contours represent the 1-, 2- and 3-σ uncertainties on ⟨V/Vmax⟩. A spectral index α = 1.6 is assumed in this figure. Similar plots obtained with other possible values of the spectral index are shown in Fig. 3. The lines show the trends of ⟨V/Vmax⟩ as a function of increasing average redshift (i.e. survey depth). The different colours (styles) thick lines show the results of the evolution of ⟨V/Vmax⟩ obtained assuming different star formation rates (as labelled, see also Sect. 5).
Current usage metrics show cumulative count of Article Views (full-text article views including HTML views, PDF and ePub downloads, according to the available data) and Abstracts Views on Vision4Press platform.
Data correspond to usage on the plateform after 2015. The current usage metrics is available 48-96 hours after online publication and is updated daily on week days.
Initial download of the metrics may take a while.