Fig. 1.
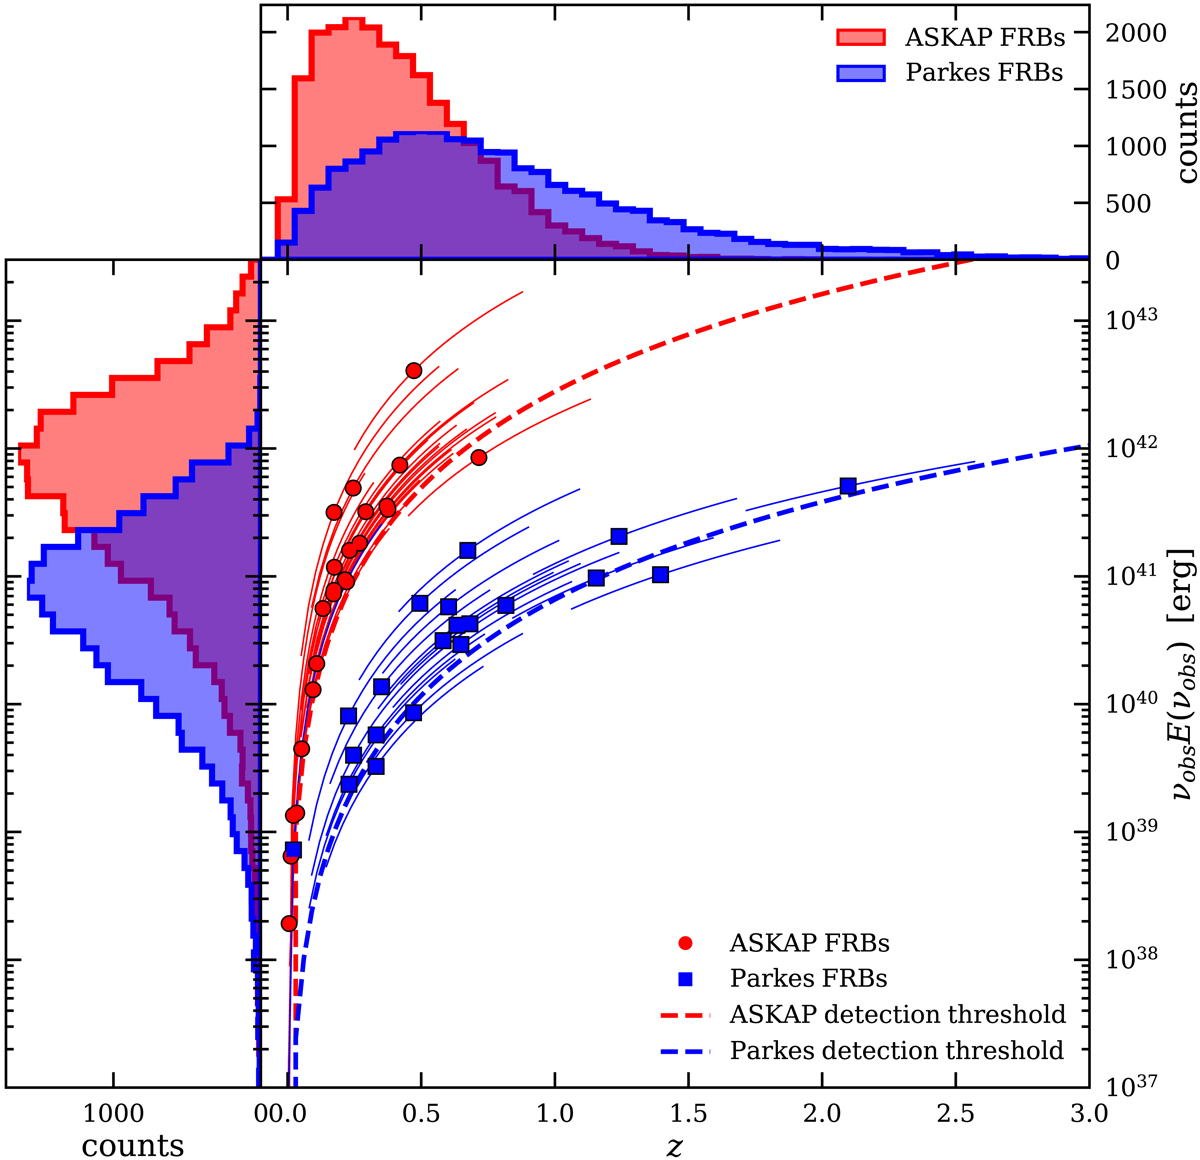
Energy (νEν) as a function of redshift for FRBs detected by ASKAP (red circles) and Parkes (blue squares). The dashed lines correspond to the fluence limit for ASKAP and Parkes (red and blue respectively) obtained assuming the average FRB duration of the respective samples. Top and right panels: energy and redshift distributions of the two samples (same colour coding of the central plot). The thin curves represent, for each data point, the 1σ uncertainty on the energy produced by the uncertainty on the redshift.
Current usage metrics show cumulative count of Article Views (full-text article views including HTML views, PDF and ePub downloads, according to the available data) and Abstracts Views on Vision4Press platform.
Data correspond to usage on the plateform after 2015. The current usage metrics is available 48-96 hours after online publication and is updated daily on week days.
Initial download of the metrics may take a while.