Free Access
Fig. 7
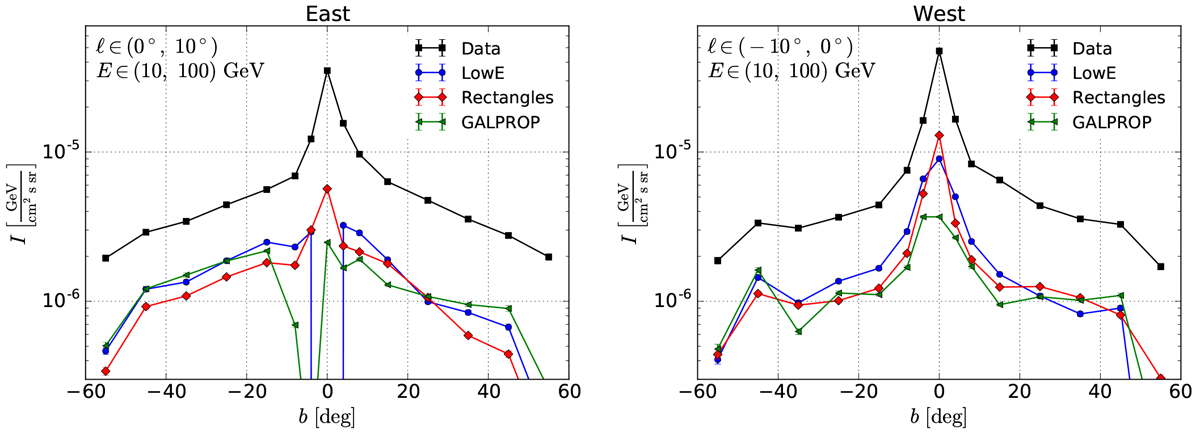
Latitude profiles of the energy flux between 10 and 100 GeV for the total data excluding the PS mask and for the FBs models for different foreground diffuse emission models to the east (left panel) and to the west (right panel) of the GC.
Current usage metrics show cumulative count of Article Views (full-text article views including HTML views, PDF and ePub downloads, according to the available data) and Abstracts Views on Vision4Press platform.
Data correspond to usage on the plateform after 2015. The current usage metrics is available 48-96 hours after online publication and is updated daily on week days.
Initial download of the metrics may take a while.