Fig. 15
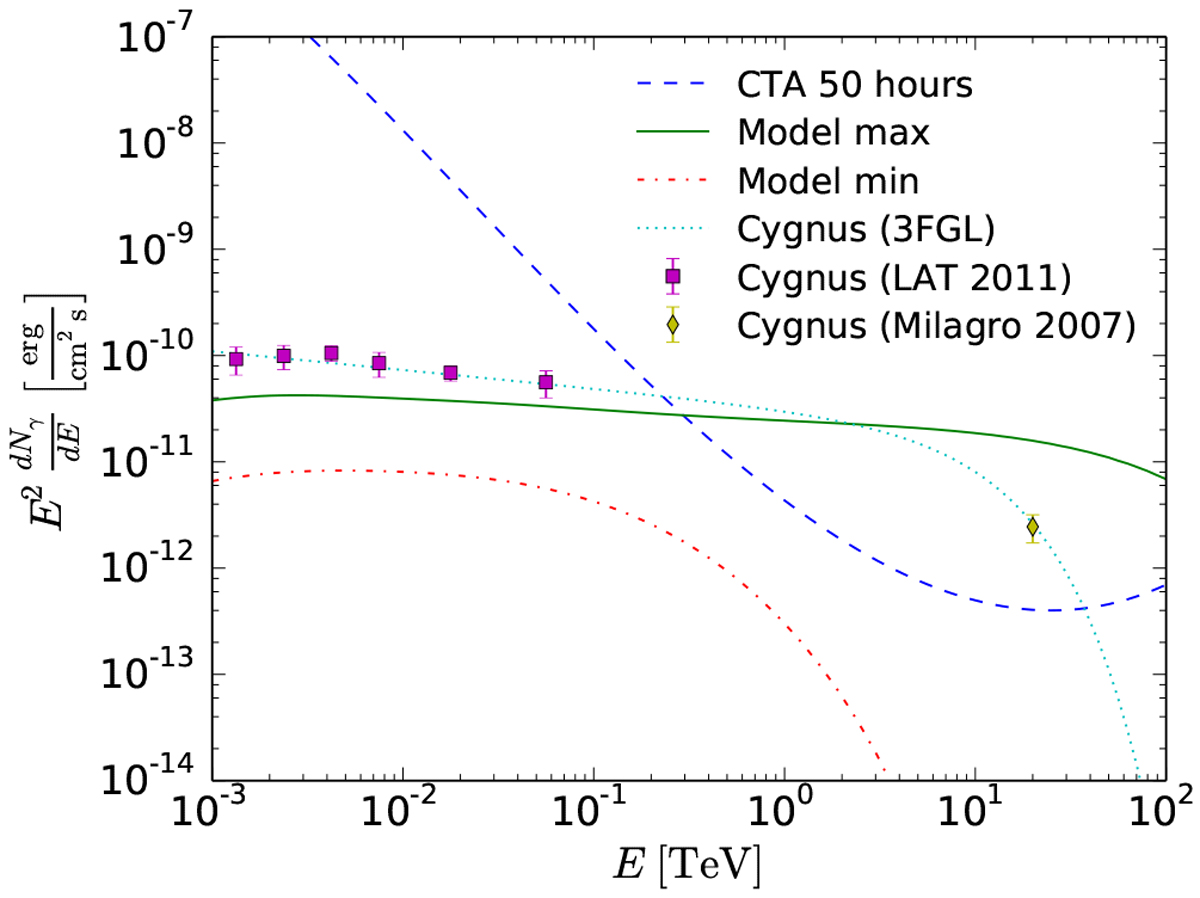
Comparison of the minimal and maximal models of the residual flux at the base of the FBs with the Cygnus cocoon spectrum. The minimal and the maximal models are the same as in Fig. 14. For the 3FGL spectrum we take the power-law parameters from the catalog (Acero et al. 2015) and add a cutoff in the gamma-ray spectrum at 10 TeV so that the SED is consistent with the Milagro source MGRO J2031+41 at 20 TeV (Abdo et al. 2007). The purple squares represent the measurement of the flux from the Cygnus cocoon by the Fermi-LAT collaboration (Ackermann et al. 2011).
Current usage metrics show cumulative count of Article Views (full-text article views including HTML views, PDF and ePub downloads, according to the available data) and Abstracts Views on Vision4Press platform.
Data correspond to usage on the plateform after 2015. The current usage metrics is available 48-96 hours after online publication and is updated daily on week days.
Initial download of the metrics may take a while.