Fig. 13
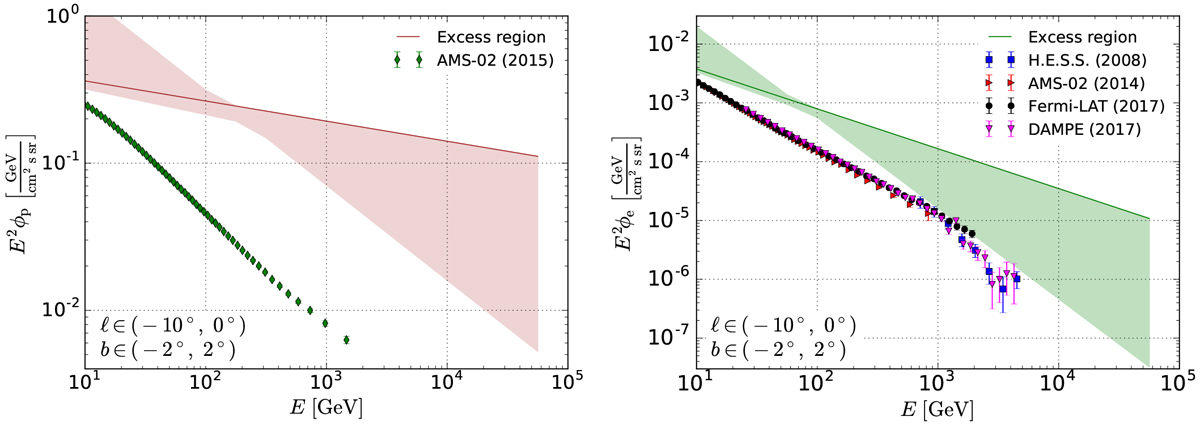
Proton (left) and electron (right) spectra fitted to the gamma-ray emission at the base of the FBs. Solid lines show the best-fit spectra in the rectangles model of the FBs. The shaded bands represent the systematic uncertainties, estimated from the maximal and minimal best-fit FBs spectra among the foreground models. Uncertainties in the ISRF energy density near the GC result in an additional factor of ~2 uncertainties in the CRe energy density (see Appendix C for details). For comparison with the local CR spectrum, we show the local fluxes of CRp measured by AMS-02 (Aguilar et al. 2015) and CRe measured by H.E.S.S. (Aharonian et al. 2008), AMS-02 (Aguilar et al. 2014), Fermi-LAT (Abdollahi et al. 2017), and DAMPE (Ambrosi et al. 2017). The error bars represent the systematic and statistical uncertainties added in quadrature.
Current usage metrics show cumulative count of Article Views (full-text article views including HTML views, PDF and ePub downloads, according to the available data) and Abstracts Views on Vision4Press platform.
Data correspond to usage on the plateform after 2015. The current usage metrics is available 48-96 hours after online publication and is updated daily on week days.
Initial download of the metrics may take a while.