Fig. 12
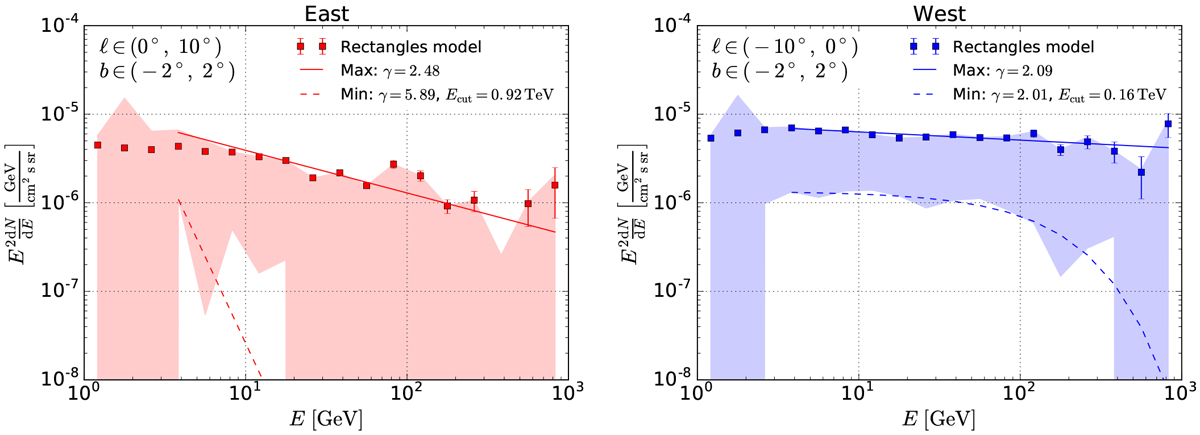
Spectral energy distribution of the FBs in the GP. The shaded areas show the envelope of the spectra of the FBs in all foreground models considered in the paper including the changes in the choice of the low-energy range to model the foreground emission (discussed in Appendix A). The lines show the fits to the maximal and minimal points in the envelopes above 3 GeV.
Current usage metrics show cumulative count of Article Views (full-text article views including HTML views, PDF and ePub downloads, according to the available data) and Abstracts Views on Vision4Press platform.
Data correspond to usage on the plateform after 2015. The current usage metrics is available 48-96 hours after online publication and is updated daily on week days.
Initial download of the metrics may take a while.