Fig. 6
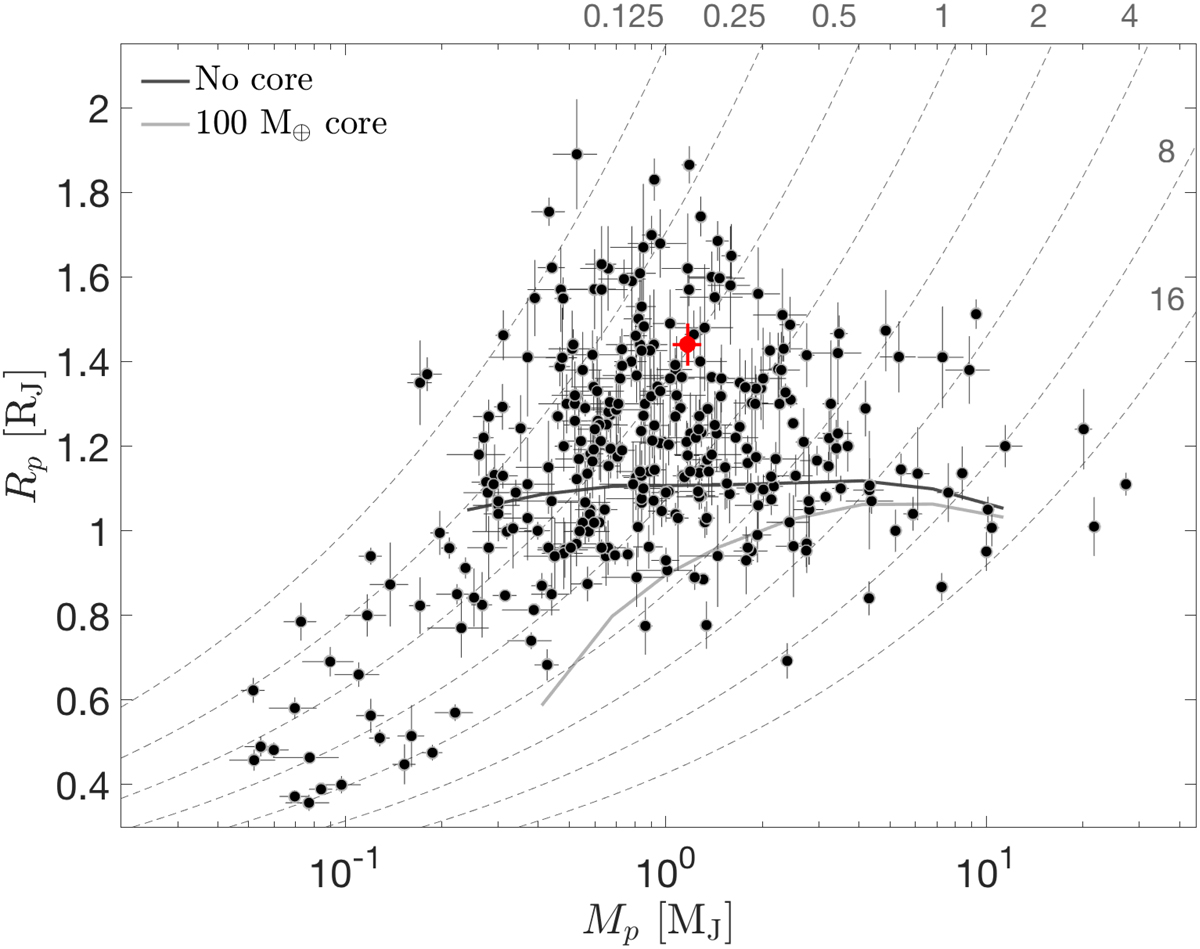
Planet radius-mass diagram for transiting gas giant planets. The mass axis is plotted in logarithmic scale. The solid lines mark theoretical models taken from Baraffe et al. (2014) for no solid core (black) and a massive core of 100 MEarth (gray). The dashed lines mark isodensity contours, with the density values labeled at the top right corner in g cm−3. The positionof HD 2685 b shows that it is an inflated gas giant planet, like other planets of similar mass. The plot includes planets whose radius uncertainty is smaller than 0.15 RJ and whose mass uncertainty is smaller than a quarter of the measured mass. Data presented in this plot were obtained from the NASA Exoplanet Archive (Akeson et al. 2013) on January 24, 2019.
Current usage metrics show cumulative count of Article Views (full-text article views including HTML views, PDF and ePub downloads, according to the available data) and Abstracts Views on Vision4Press platform.
Data correspond to usage on the plateform after 2015. The current usage metrics is available 48-96 hours after online publication and is updated daily on week days.
Initial download of the metrics may take a while.