Free Access
Fig. 4
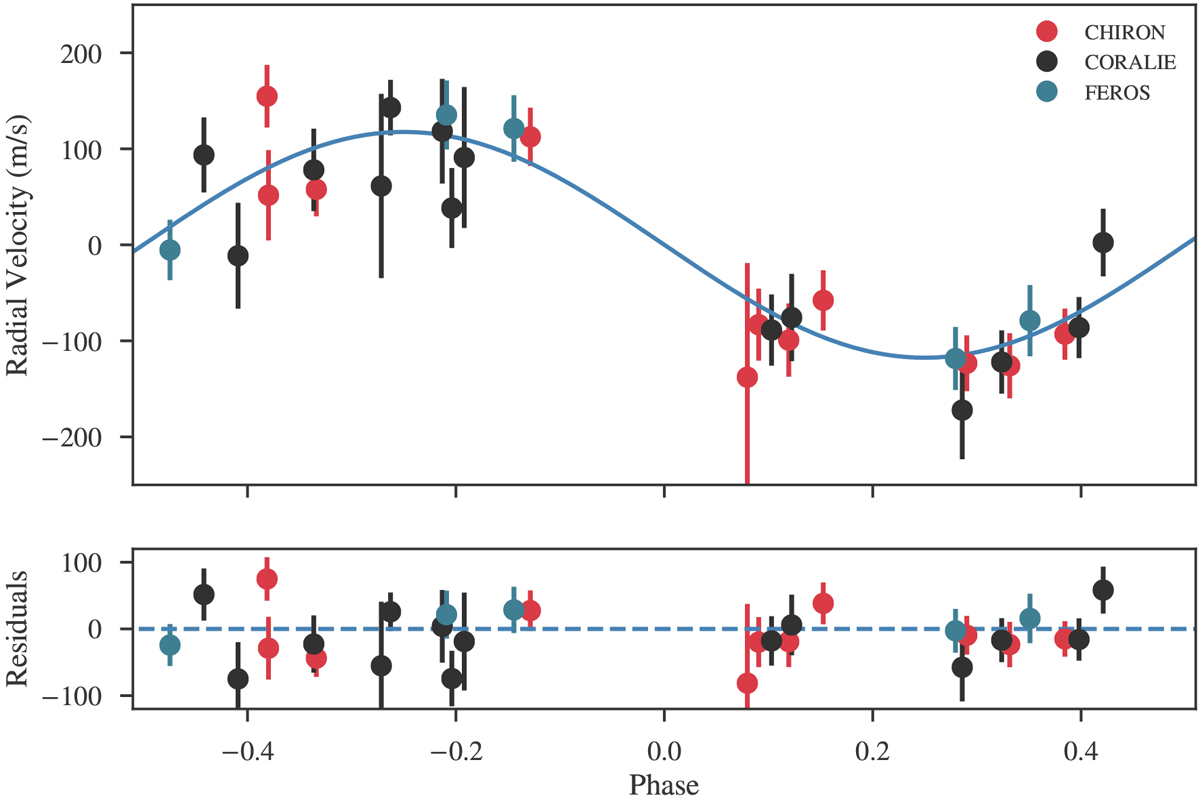
Phase-folded RV curve of HD 2685. The black, red, and blue points correspond to CORALIE, CHIRON, and FEROS velocities, respectively. The best Keplerian fit from the joint analysis is overplotted. The post-fit residuals are shown in the lower panel.
Current usage metrics show cumulative count of Article Views (full-text article views including HTML views, PDF and ePub downloads, according to the available data) and Abstracts Views on Vision4Press platform.
Data correspond to usage on the plateform after 2015. The current usage metrics is available 48-96 hours after online publication and is updated daily on week days.
Initial download of the metrics may take a while.