Fig. 1
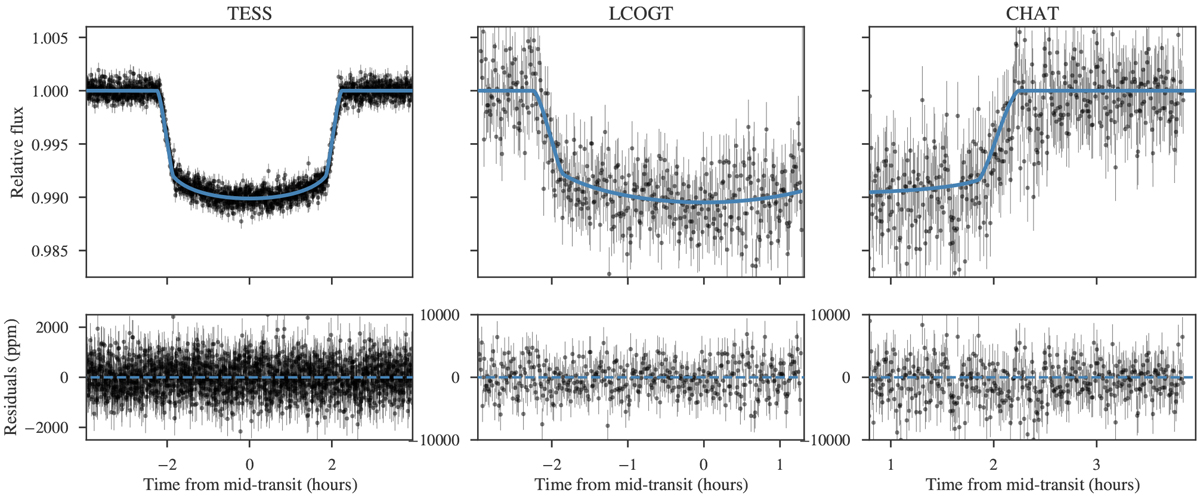
Left: detrended and phase-folded TESS light curve of HD 2685 during the transit. The solid blue line corresponds to the transit fit from the joint analysis. Middle: LCOGT photometric data covering the ingress and middle part of one individual transit. Right: CHAT data covering the egress of the same transit event as observed by LCOGT.
Current usage metrics show cumulative count of Article Views (full-text article views including HTML views, PDF and ePub downloads, according to the available data) and Abstracts Views on Vision4Press platform.
Data correspond to usage on the plateform after 2015. The current usage metrics is available 48-96 hours after online publication and is updated daily on week days.
Initial download of the metrics may take a while.