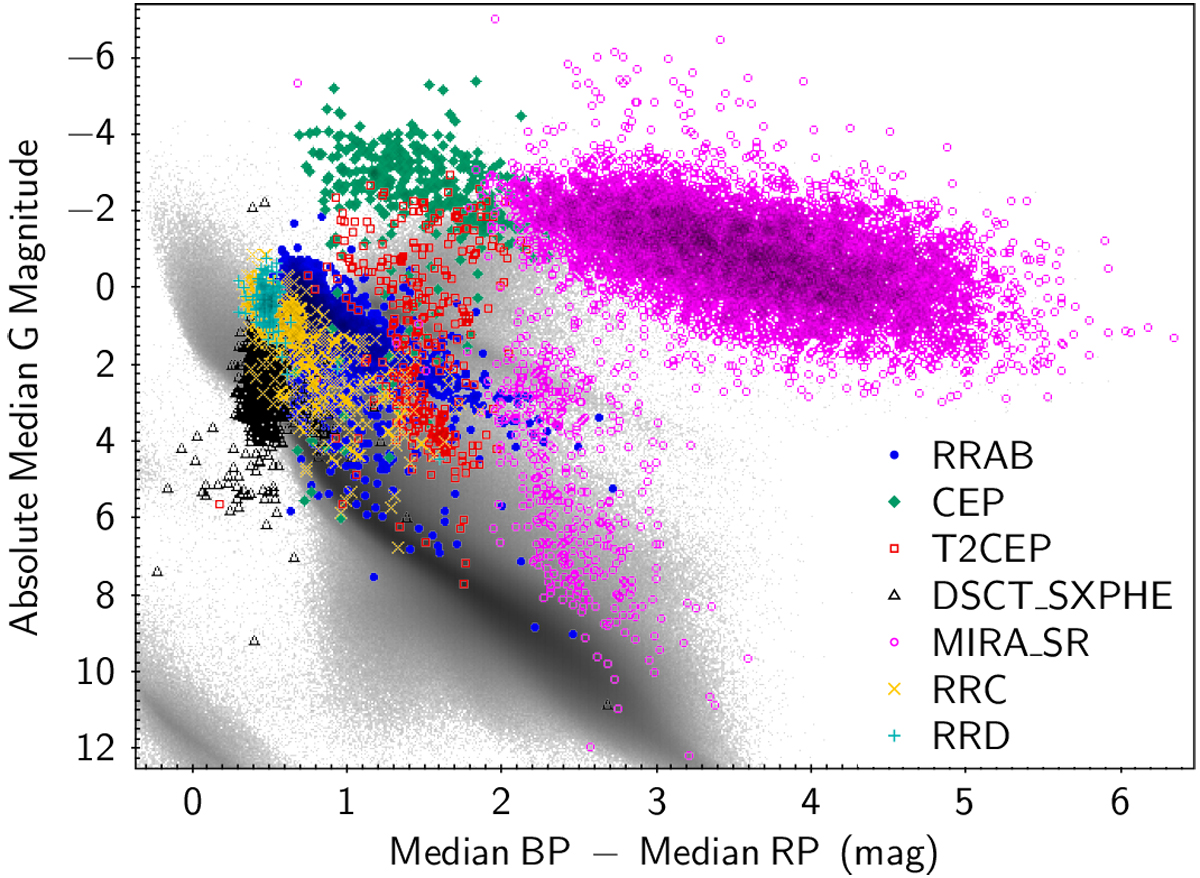
Fig. 7

Colour-absolute magnitude diagram (as absolute median G-band magnitude vs. median GBP− median GRP) of a selection of classification candidates: fundamental mode (RRAB, blue dots), first-overtone (RRC, orange “×” marks), and double-mode (RRD, cyan “+” marks) RR Lyrae types, classical (CEP, green rhombi) and type-II (T2CEP, red squares) Cepheids, δ Scuti/SX Phoenicis types (DSCT_SXPHE, black triangles), and Mira/semiregular types (MIRA_SR, magenta circles). Faint outliers typically denote contaminating objects, which in the case of long-period variables, are represented mostly by young stellar objects. All of these sources satisfy the conditions listed in Appendix B of Gaia Collaboration (2019), among which a relative parallax precision better than 20%, with no correction for interstellar or circumstellar extinction or reddening. The background points in grey act as a reference of objects within a radius of 1 kpc from the Sun.
Current usage metrics show cumulative count of Article Views (full-text article views including HTML views, PDF and ePub downloads, according to the available data) and Abstracts Views on Vision4Press platform.
Data correspond to usage on the plateform after 2015. The current usage metrics is available 48-96 hours after online publication and is updated daily on week days.
Initial download of the metrics may take a while.


