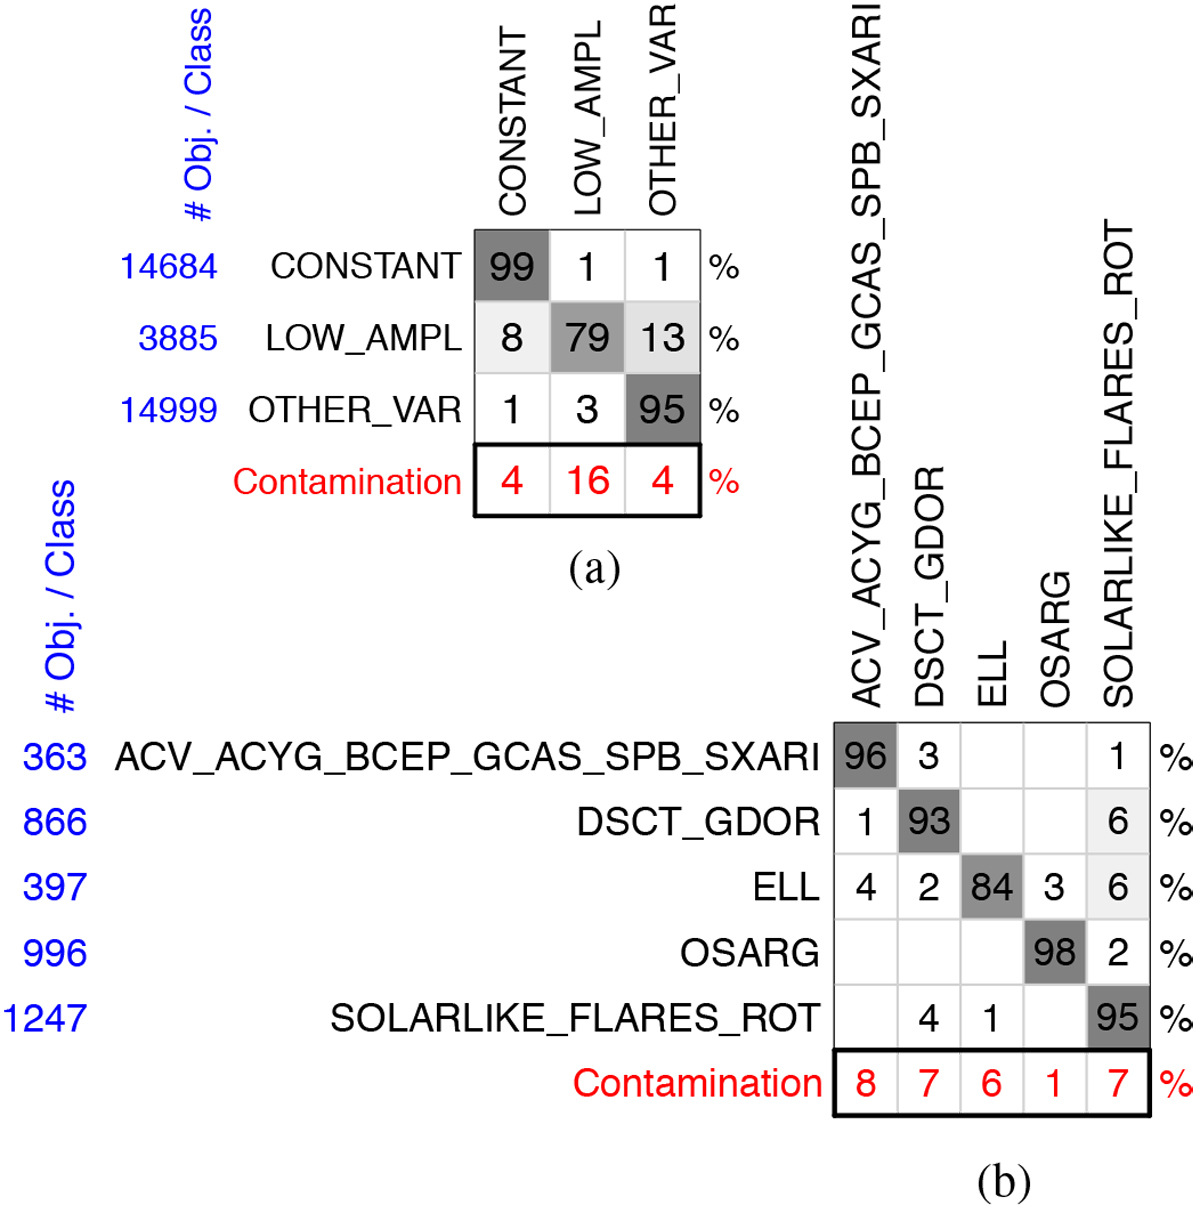
Fig. 4

Confusion matrices of classifiers 1 (panel a) and 2 (panel b), as denoted in Fig. 3. The classifications of training objects (in rows) are compared with classifier results (in columns), which are estimated from the out-of-bag sources in random forest. Given the amount of true positives (TP), false positives (FP), and false negatives (FN), the completeness [TP/(TP+FN)] and contamination [FP/(TP+FP)] rates, expressed as rounded per-cent values, appear in the diagonal (in black) and the bottom row (in red), respectively, while the numbers of training objects per class are listed in blue on the left-hand side of each matrix. Rounded rates imply that not all rows sum to 100%. Rates below 0.5% are not shown to facilitate the reading of the most relevant parts. Darker shaded squares are used to highlight higher occurrence rates.
Current usage metrics show cumulative count of Article Views (full-text article views including HTML views, PDF and ePub downloads, according to the available data) and Abstracts Views on Vision4Press platform.
Data correspond to usage on the plateform after 2015. The current usage metrics is available 48-96 hours after online publication and is updated daily on week days.
Initial download of the metrics may take a while.


