| Issue |
A&A
Volume 625, May 2019
|
|
|---|---|---|
| Article Number | A55 | |
| Number of page(s) | 8 | |
| Section | Interstellar and circumstellar matter | |
| DOI | https://doi.org/10.1051/0004-6361/201834576 | |
| Published online | 10 May 2019 | |
The relation between 5780 and 5797 diffuse interstellar bands, CH/CH+ molecules, and atomic or molecular hydrogen
Institute of Physics, Kazimierz Wielki University,
Weyssenhoffa 11,
85-072 Bydgoszcz,
Poland
e-mail: This email address is being protected from spambots. You need JavaScript enabled to view it.
Received:
5
November
2018
Accepted:
16
March
2019
Abstract
Correlations between column densities of neutral and molecular hydrogen and strengths of major 5780 and 5797 Å diffuse interstellar bands (DIBs) based on spectra of 66 OB stars were analyzed. We confirm that the 5797 Å DIB is more tightly correlated with column density of molecular hydrogen while the 5780 DIB – with that of atomic hydrogen. This leads to a reasonably tight relation between the molecular fraction of H2 and equivalent width ratio of the 5797 and 5780 major diffuse bands with correlation coefficient equal to 0.77 ± 0.05. Column densities of CH and CH+ molecules were used to analyze correlations between abundances of CH/CH+ molecules and strengths of the major 5780 and 5797 DIBs. The 5780 DIB is better correlated with the column density of methydyline cation than the 5797 DIB. A relation with correlation coefficient equal to 0.95 ± 0.02 based on precise column densities, between column densities of CH and H2 molecules, is also presented; in other words, the column densitiy ratio in the case of H2 and CH molecules in the ISM is equal to (2.01 ± 0.09) × 107.
Key words: ISM: clouds
© ESO 2019
1 Introduction
Since the discovery of two major diffuse interstellar bands (DIBs) at 5780 and 5797 Å (Heger 1922) the number of known DIBs has grown up to the current number of more than 400 entries; however the problem of their origin remains unsolved. According to recent surveys of DIBs (Galazutdinov et al. 2000; Weselak et al. 2000; Hobbs et al. 2009; Cox et al. 2014) these features cover the visible and near infrared spectral region (most of them are weak); the recent survey of Hobbs et al. 2009 lists 414 features of this type in the spectrum of the heavily reddened object HD 183143.
Herbig (1993) presented that the strength of the 5780 DIB may be controlled by the column density of neutral hydrogen. Recently, Weselak et al. (2008a) has suggested that the intensity of the 5797 DIB is better correlated with column density of the CH molecule than that of the major 5780 DIB. This result suggests that carriers of some DIBs prefer different environments, characterized by different physical parameters. Results based on high-resolution profiles of strong DIBs (Sarre et al. 1995; Kerr et al. 1998) suggest that DIBs are carried by complex molecules.
Molecular hydrogen H2 is relatively rich in diffuse and translucent clouds (Savage et al. 1977); column densities of H2 typically exceed the value 1019 cm−2 toward reddened OB stars. This result is also supported with another set of column densities of Rachford et al. (2002, 2009), Pan et al. (2004), and Snow et al. (2008). It is also known, that neither molecular nor neutral hydrogen correlates with column density of the CH cation (Weselak et al. 2008b), while H2 and CH molecules correlate very tightly (Mattila 1986; Weselak et al. 2004). The OH molecule (Weselak et al. 2009a, 2010) also seems to be related to the two mentioned above.
The varying strength ratio of the two prominent DIBs: 5780 and 5797 shown by Krełowski & Westerlund (1988) in spectra of σ Sco and ζ Oph suggested that physical conditions that facilitate formation and survival their carriers may differ. Previous works of Herbig (1993) based on 93 sightlines, Friedman et al. 2011 (133 stars), and Fan et al. 2017 (186 objects) investigated correlations between intensities of selected DIBs and the column densities of molecular and atomic species, including HI and H2. In this work, these results concerning the major 5780 and 5797 Å DIBs based on spectra of 66 objects from a database is examined. Data on atomic and molecular hydrogen are taken from the literature and column densities of CH and CH+ molecules are based on previously published and checked oscillator strengths of unsaturated lines (Weselak et al. 2009b, 2014, respectively).
2 Observational data
The observational material includes objects for which information on molecular or neutral hydrogen is available from the literature. They include the spectra of the OAO–3 Copernicus satellite as well as those acquired using the FUSE extraterrestrial observatory. In the case of 66 such objects, listed in Table A.1 the applied Coudé échelle spectrographs were: MAESTRO (t) fed by the 2-m telescope of the Observatory at Peak Terskol (t) in the Northern Caucasus (Musaev et al. 1999), (R = 80 000); FEROS (f) (Kaufer et al. 1999) fed with the 2.2 m ESO telescope1, (R = 48 000); BOES (b) fed by the 1.8-m telescope of the Bohyunsan Optical Astronomy Observatory (BOAO), (R = 90 000) (Kim et al. 2007); and HARPS (H) fed with the 3.6 m ESO telescope in Chile (see Mayor et al. 2003) (R = 115 000). Spectra of four objects were obtained using the UVES spectrograph at ESO Paranal in Chile (v) with spectral resolution R = 80 000 (Dekker et al. 2000). They were downloaded from the Library of High-Resolution Spectra of Stars across the Hertzsbrung-Russell Diagram2. For more information see Bagnulo et al. (2003). Typical signal to noise ratios of spectra used in this project range from about 300 to 700.
All the spectra were reduced using the standard packages: MIDAS and IRAF, as well as our own DECH code (Galazutdinov 1992), which provides all the standard procedures of image and spectra processing. The application of different computer codes to the data reduction procedures reduces the possibility of inaccuracies following the slightly different ways of dark subtraction, flatfielding, or excision of cosmic ray hits. In each case, the continuum placement and equivalent width measurements of DIBs were done as presented by Weselak et al. (2004, 2008a).
Calculated correlation coefficients (R) with errors (Error), number of stars used in data analysis (Ncalc), and excluded from data analysis – meaning that data were available (Nexcl).
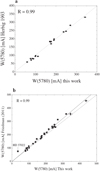 |
Fig. 1 New measurements of the equivalent widths of 5780 DIB compared to those of Herbig (1993) (a) and Friedman et al. (2011) (b). We note a systematic difference that can be seen in panel b (the dotted line represents equal values in both panels). |
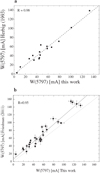 |
Fig. 2 New measurements of the equivalent widths of 5797 DIB compared to those of Herbig (1993) (a) and Friedman et al. (2011) (b). We note a systematic difference that can be seen in panel b (the dotted line represents equal values in both panels). |
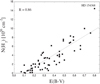 |
Fig. 3 Correlation plot between column densities of H2 molecule and color excess E(B − V). The relation is close (correlation coefficient equal to 0.86). The object with the highest abundance of H2 is HD 154368. |
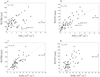 |
Fig. 4 Equivalent widths of the 5780 and 5797 DIBs correlated with column densities of H2 (top panels) and HI (bottom). Closer relations are emphasized with the fitted straight lines. 5797 DIB correlates better with N(H2), while 5780 DIB with N(HI) (correlation coefficients equal to 0.75 and 0.74, respectively). Uncertain column density of HI in the case of HD 152236 was not used in calculations. |
3 Results and discussion
Table A.1 presents the HD number, spectral type, and luminosity class, as well as E(B–V), color excess for each star, equivalent widths (Wλ) (in mÅ) of 5780 and 5797 DIBs, intensity ratio of two major 5780 and 5797 DIBs as well as column densities (in 1020 cm−2) of H2 and HI, molecular fraction of H2 (i.e. f(H2 = 2N(H2)/(2N(H2) + HI)) taken from the literature, column densities (in 1012 cm−2) of CH and CH+ molecules. The Sp/L estimates of target stars as well as B, V photometry were taken from the Simbad database; the calculated color excesses E(B–V) are based on intrinsic colors of Papaj et al. (1993). In the case of each DIB its equivalent width was compared with that already published by Herbig (1993) and Friedman et al. (2011).
To obtain column densities of CH and CH+ molecules we used checked oscillator strengths of usaturated lines at 3886, 3890, 4300 Å (see Weselak et al. 2014) and those at 3957 and 4232 Å (Weselak et al. 2009b), respectively. Measurements of interstellar CH and CH+ lines are presented in Table A.2.
In Table 1 we present calculated correlation coefficients with errors and number of stars used in data analysis in the case of each relation presented in Figs. 3–8. In Fig. 1 equivalent widths of the broad 5780 DIB with those published by Herbig (1993) and Friedman et al. (2011) are presented. In both cases the relationship is very tight, with a correlation coefficient equal to 0.99. However, comparing our measurements with those of Friedman et al. (2011) one can find a systematic difference while new measurements agree exactly with those of Herbig (1993). This is also clearly seen in Fig. 2, where new measurements are presented concerning the 5797 DIB. Typical differences between equivalent widths of the 5797 DIB measured in this work and by Friedman et al. (2011) are equal to 15% (Fig. 2b). Equivalent widths of the major 5780 and 5797 DIBs were measured exactly as presented in Fig. 1 of Weselak et al. (2004) and Fig. 1 of Weselak et al. (2008a). Measurements were not obtained using the semi-automated program and were performed by the author himself. In the case of the 5797 DIB contaminated with the stellar line of CIV (Weselak et al. 2000) a measurement of its equivalent width (bl in Table A.1) was not possible.
In Fig. 3 we present the relation between column densities of molecular hydrogen and interstellar extinction E(B–V). The relation is quite tight with the correlation coefficient equal to 0.86; this value was suggested by Friedman et al. (2011) as a threshold toindicate that two ISM quantities could be physically related. This result is also consistent with that published by Herbig (1993), Weselak et al. (2004, 2008b), Snow et al. (2008), and Rachford et al. (2009) and is based on more numerous sample of objects (66). Generally, intensities of H2 grow with E(B–V), suggesting that column densities molecular hydrogen and E(B–V) are mutually correlated and H2 is formed on dust grains (Barlow & Silk 1976). In the case of the relation between column densities of the H2 molecule and E(B–V), a sharp transition from small to high values at E(B–V) = 0.08 is observed (Savage et al. 1977), due to the fact that H2 molecules become self-shielded. In Fig. 3 one data-point (HD 154368) which lies outside the relation is characterized with high abundance of H2 (Snow 1996), CH (Weselak et al. 2008a), and OH molecules (Weselak et al. 2009a). The correlations between equivalent widths of the 5780, 5797 DIBs and E(B–V) were also examined. Results presented here are consistent with those presented by Weselak et al. (2008a). Column densities of the H2 molecule and the 5797 DIB correlate better with E(B–V) than the 5780 DIB with correlation coefficients equal to 0.86, 0.81 and 0.66, respectively.
Figure 4 presents correlation plots between equivalent widths of the major 5780 and 5797 DIBs and column densities of H2 /HI. It is well seen that the 5797 DIB correlates better with column density of H2 (with correlation coefficient equal to 0.75) than the 5780 DIB does (0.42). However, the latter correlates better with the column density of HI – correlation coefficient equal to 0.74 (see also the correlation coefficients in the plots). The better correlations in Fig. 4 are also emphasized by the plot of the straight line fitted to the data points. This result is consistent with that of Herbig (1993) who found that W(5780) increases with column density of HI. Also, with that of Friedman et al. (2011) who found correlation coefficients equal to 0.79 in the case of relation between column density of H2 and the 5797 DIB and 0.65 in the case of H2 and 5780 DIB. Also, consistent with that of Lan et al. (2015) who examined relations between DIBs and HI/ H2 for targets from SDSS. In Fig. 4 several discrepant points can be found – those with extraordinarily high abundances of H2 (and also CH molecules) – HD’s 24534, 27778, 154368. One discrepant point with high value of HI is HD 152236, in case of which the column density of HI presented in the work of Diplas & Savage (1994) was based on the work of Lesh (1972), where no column density of HI is given (in any case the column density of HI for HD 152236 is not used in our calculations).
Figure 5 presents a relation between hydrogen molecular fraction and intensity ratio of the major 5797 and 5780 DIBs. In this case the linear correlation coefficient equal to 0.77 is observed with one point with high value of hydrogen molecular fraction outside the relation (HD 154368). The relation between molecular hydrogen fraction and intensity ratios of the 5797 and 5780 DIBs is probably linear and suggests that the molecular hydrogen fraction is related to the intensity ratio of the 5797 and 5780 DIBs. This result is expected for zeta and sigma DIBs (Friedman et al. 2011) and is consistent with that presented by Weselak et al. (2004) (correlation coefficient equal to 0.83 based on central depths of 5797 and 5780 DIBs).
Figure 6 presents a relation between hydrogen molecular fraction and equivalent widths of the 5780 and 5797 DIBs normalized with E(B–V). A weak relation with correlation coefficient (–0.55) is seen only in the case of the major 5780 DIB. This also suggests that carriers of the major 5780 DIB are probably connected with HI.
In Fig. 7 we present relation between column densities of CH and CH+ molecules and strengths of the 5780 and 5797 DIBs. In Fig. 7c two discrepant points with high abundances of CH+, that is HD 149757 and HD 34078, can be seen. We can see clearly in Fig. 7a and c that 5780 DIB is better correlated with column densities of CH+ than CH with correlation coefficients equal to 0.72 and 0.32, respectively. The CH molecule is better correlated with the 5797 DIB as it was presented by Weselak et al. (2008a). The later is not correlated with column density of CH+ (Fig. 7d).
Finally, in Fig. 8 the relation between column densities of CH and H2 molecules is presented with correlation coefficient equal to 0.95. The former were obtained based on an unsaturated features of CH molecule and previously checked oscillator strengths of their transitions at 3886, 3890 and 4300 Å. This result is consistent with previously published by Federman (1982), Weselak et al. (2004), Rachford et al. (2009), Fan et al. (2017) (correlation coefficient equal to 0.92). The CH molecule is also well correlated with atomic species as NaI (Smoker et al. 2014) while the formation of CH+ is rather complicated (Zsargo & Federman 2003). Apparently the column densitiy ratio in the case of H2 and CH molecules in the ISM is equal to 2 × 10⁷ and can be used to obtain column densities of H2 on the basis of those of CH molecule (Fig. 8).
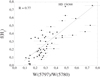 |
Fig. 5 Correlation plot between hydrogen molecular fraction f(H2) and equivalent width ratio of 5797 and 5780 DIBs. The fit to the data points is represented with a straight dotted line. The calculated correlation coefficient is equal to 0.77. |
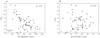 |
Fig. 6 Molecular fraction f(H2) correlated with equivalent widths of the 5780 and 5797 DIBs normalized with E(B– V). A weak relation only in the case of 5780 DIB is seen (panel a) – shown by the straight dotted line. |
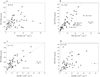 |
Fig. 7 Equivalent widths of the 5780 and 5797 DIBs correlated with column densities of CH (top panels) and CH+ (bottom). Closer relations are emphasized with the fitted straight lines. 5797 DIB is more closely correlated with N(CH), while 5780 DIB with N(CH+) with correlation coefficients equal to 0.89 and 0.72, respectively. Data points with HD numbers in panels b and c were not used in calculations. If the same data points were also not used in panels a and d, calculated correlation coefficients were equal 0.56 and 0.53, respectively. |
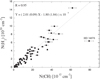 |
Fig. 8 Correlation plot between column density of H2 and CH molecules with correlation coeffficient equal to 0.95. A fit to data points is presented with dotted line. HD 34078 was not used in calculations. |
4 Conclusions
The above considerations allow us to infer the following conclusions:
- 1.
The column density of molecular hydrogen is well correlated with E(B–V) suggesting the formation of H2 on dust grains (Fig. 3).
- 2.
Equivalent widths of the 5797 DIB are better correlated with column densities of H2 while those of the 5780 DIB – with HI (Fig. 4).
- 3.
The equivalent width ratio of the major 5797 and 5780 DIBs grows together with the fraction of molecular hydrogen (Fig. 5).
- 4.
Molecular fraction of H2 is weaklyanticorrelated with equivalent widths of 5780 DIB normalized with E(B–V) (Fig. 6).
- 5.
Equivalent widths of the major 5780 DIB are better correlated with column densities of CH+ while those of 5797 DIB – with CH (Fig. 7).
- 6.
The column densities of molecular hydrogen are very well correlated with those of CH, meaning that these two species originate and are preserved in the same environments (Fig. 8).
The results found here are compelling indicators that abundances of molecular and atomic hydrogen and CH/CH+ molecules are probably connected to those of the carriers of major DIBs. This kind of information, obtained also in case of other DIBs, may be essential in identifying physical conditions of environments in which they are formed.
Acknowledgements
The author is grateful to the anonymous referee for valuable suggestions that allowed him to improve the final version of the manuscript.
Appendix A Additional tables
Observational and measurement data.
Measured equivalent widths (in mÅ) of interstellar lines CH (at 3886, 3890 and 4300 Å), and CH+ molecule (at 3957 and 4232 Å).
References
- Bagnulo, S., Jehin, E., Ledoux, C., et al. 2003, The Messenger, 114, 10 [NASA ADS] [Google Scholar]
- Barlow, M. J., & Silk, J. 1976, ApJ, 207, 131 [NASA ADS] [CrossRef] [Google Scholar]
- Burgh, E. B., France, K., McCandliss, S.R., et al. 2007, ApJ, 658, 446 [NASA ADS] [CrossRef] [Google Scholar]
- Cox, N. L. J., Cami, J., Kaper, L., et al. 2014, A&A, 569, A117 [NASA ADS] [CrossRef] [EDP Sciences] [Google Scholar]
- Dekker, H., D’Odorico, S., Kaufer, A., Delabre, B., & Kotzlowski, H. 2000, SPIE, 4008, 534 [Google Scholar]
- Diplas, A., & Savage, B. D. 1994, ApJS, 93, 211 [NASA ADS] [CrossRef] [Google Scholar]
- Fan, H., Welty, D. E., York, D. G., et al. 2017, ApJ, 850, 194 [NASA ADS] [CrossRef] [Google Scholar]
- Federman, S. R. 1982, ApJ, 257, 125 [NASA ADS] [CrossRef] [Google Scholar]
- Fitzpatrick, E. L., & Massa, D. 1990, ApJS, 72, 163 [NASA ADS] [CrossRef] [Google Scholar]
- Friedman, S. D., York, D. G., McCall, B. J., et al. 2011, ApJ, 727, 33 [NASA ADS] [CrossRef] [Google Scholar]
- Galazutdinov, G. A. 1992, Prep. Spets. Astrof. Obs., 92 [Google Scholar]
- Galazutdinov, G. A., Musaev, F. A., Krełowski, J., & Walker, G. A. H. 2000, PASP, 112, 648 [NASA ADS] [CrossRef] [Google Scholar]
- Hanson, M. M., Snow, T. P., & Black, J. H. 1992, ApJ, 392, 571 [NASA ADS] [CrossRef] [Google Scholar]
- Heger, M. L. 1922, Lick Obs. Bull. 10, 146 [NASA ADS] [Google Scholar]
- Herbig, G. H. 1993, ApJ, 407, 142 [NASA ADS] [CrossRef] [Google Scholar]
- Hobbs, L. M., York, D. G., Thorburn, J. A., et al. 2009, ApJ, 705, 32 [NASA ADS] [CrossRef] [Google Scholar]
- Kaufer, A., Stahl, O., Tubbesing, S., et al. 1999, The Messenger, 95, 8 [Google Scholar]
- Kerr, T. H., Hibbins, R. E., Fossey, S. J., Miles, J. R., & Sarre, P. J. 1998, ApJ, 495, 941 [NASA ADS] [CrossRef] [Google Scholar]
- Kim, K. M., Han, I., & Valzavin, G. G. 2007, PASP, 119, 1052 [Google Scholar]
- Krełowski, J., & Westerlund, B. E. 1988, A&A, 190, 339 [NASA ADS] [Google Scholar]
- Lan, T.-W., Menard, B., & Zhu, G. 2015, MNRAS, 452, 3629 [Google Scholar]
- Lesh, J. R. 1972, A&AS, 5, 129 [NASA ADS] [Google Scholar]
- Mattila, K. 1986, A&A, 160, 157 [NASA ADS] [Google Scholar]
- Mayor, M., Pepe, F., Queloz, D., et al. 2003, The Messenger, 114, 20 [NASA ADS] [Google Scholar]
- Musaev, F. A., Galazutdinov, G. A., Sergeev, A. V., Karpov, N. V., & Podyachev, Yu. V. 1999, Kinematika Fiz.Nebesn. Tel., 15, 3 [Google Scholar]
- Pan, K., Federman, S. R., Cunha, K., Smith, V. V., & Welty, D. E. 2004, ApJS, 151, 313 [NASA ADS] [CrossRef] [Google Scholar]
- Papaj, J., Krelowski, J., & Wegner, W. 1993, A&A, 273, 575 [NASA ADS] [Google Scholar]
- Rachford, B. L., Snow, T. P., Tumlinson, J., et al. 2001, ApJ, 555, 839 [NASA ADS] [CrossRef] [Google Scholar]
- Rachford, B. L., Snow, T. P., Tumlinson, J., et al. 2002, ApJ, 577, 221 [NASA ADS] [CrossRef] [Google Scholar]
- Rachford, B. L., Snow, T. P., Tumlinson, J., et al. 2009, ApJS, 180, 125 [NASA ADS] [CrossRef] [Google Scholar]
- Sarre, P. J., Miles, J. R., Kerr, T. H., et al. 1995, MNRAS, 277, 41 [NASA ADS] [CrossRef] [Google Scholar]
- Savage, B. D., Bohlin, R. C., Drake, J. F., & Budich, W., 1977, ApJ, 216, 291 [NASA ADS] [CrossRef] [Google Scholar]
- Sheffer, Y., Rogers, M., Federman, S. R., et al. 2007, ApJ, 667, 1002 [NASA ADS] [CrossRef] [Google Scholar]
- Sheffer, Y., Rogers, M., Federman, S. R., et al. 2008, ApJ, 687, 1075 [NASA ADS] [CrossRef] [Google Scholar]
- Smoker, J., Ledoux, C., Jehin, E., et al. 2014, MNRAS, 438, 1127 [NASA ADS] [CrossRef] [Google Scholar]
- Snow, T. P. 1996, ApJ, 465, 245 [NASA ADS] [CrossRef] [Google Scholar]
- Snow, T. P., Ross, T. L., Destree, J. D., et al. 2008, ApJ, 688, 1124 [NASA ADS] [CrossRef] [Google Scholar]
- Savage, B. D., Bohlin, R. C., Drake, J. F., & Budich, W. 1977, ApJ, 216, 291 [NASA ADS] [CrossRef] [Google Scholar]
- Weselak, T., Schmidt, M., & Krełowski, J. 2000, A&AS, 142, 239 [NASA ADS] [CrossRef] [EDP Sciences] [Google Scholar]
- Weselak, T., Galazutdinov, G. A., Musaev, F. A., & Krełowski, J. 2004, A&A, 414, 949 [NASA ADS] [CrossRef] [EDP Sciences] [Google Scholar]
- Weselak, T., Galazutdinov, G. A., Musaev, F. A., & Krełowski, J. 2008a, A&A, 484, 381 [NASA ADS] [CrossRef] [EDP Sciences] [Google Scholar]
- Weselak, T., Galazutdinov, G. A., Musaev, F. A., & Krełowski, J. 2008b, A&A, 479, 149 [NASA ADS] [CrossRef] [EDP Sciences] [Google Scholar]
- Weselak, T., Galazutdinov, G. A., Beletsky, Y., & Krełowski, J. 2009a, A&A, 499, 783 [NASA ADS] [CrossRef] [EDP Sciences] [Google Scholar]
- Weselak, T., Galazutdinov, G. A., Musaev, F. A., Beletsky, Y., & Krełowski, J. 2009b, A&A, 495, 189 [NASA ADS] [CrossRef] [EDP Sciences] [Google Scholar]
- Weselak, T., Galazutdinov, G. A., Beletsky, Y., & Krełowski, J. 2010, MNRAS, 402, 1991 [NASA ADS] [CrossRef] [Google Scholar]
- Weselak, T., Galazutdinov, G. A., Gnaciński, P., & Krełowski, J. 2014, Acta Astron., 64, 277 [NASA ADS] [Google Scholar]
- Zsargo, J., & Federman, S. R. 2003, ApJ, 589, 319 [NASA ADS] [CrossRef] [Google Scholar]
Available at the website: http://www.sc.eso.org/santiago/uvespop
All Tables
Calculated correlation coefficients (R) with errors (Error), number of stars used in data analysis (Ncalc), and excluded from data analysis – meaning that data were available (Nexcl).
Measured equivalent widths (in mÅ) of interstellar lines CH (at 3886, 3890 and 4300 Å), and CH+ molecule (at 3957 and 4232 Å).
All Figures
|
Fig. 1 New measurements of the equivalent widths of 5780 DIB compared to those of Herbig (1993) (a) and Friedman et al. (2011) (b). We note a systematic difference that can be seen in panel b (the dotted line represents equal values in both panels). |
| In the text | |
|
Fig. 2 New measurements of the equivalent widths of 5797 DIB compared to those of Herbig (1993) (a) and Friedman et al. (2011) (b). We note a systematic difference that can be seen in panel b (the dotted line represents equal values in both panels). |
| In the text | |
|
Fig. 3 Correlation plot between column densities of H2 molecule and color excess E(B − V). The relation is close (correlation coefficient equal to 0.86). The object with the highest abundance of H2 is HD 154368. |
| In the text | |
|
Fig. 4 Equivalent widths of the 5780 and 5797 DIBs correlated with column densities of H2 (top panels) and HI (bottom). Closer relations are emphasized with the fitted straight lines. 5797 DIB correlates better with N(H2), while 5780 DIB with N(HI) (correlation coefficients equal to 0.75 and 0.74, respectively). Uncertain column density of HI in the case of HD 152236 was not used in calculations. |
| In the text | |
|
Fig. 5 Correlation plot between hydrogen molecular fraction f(H2) and equivalent width ratio of 5797 and 5780 DIBs. The fit to the data points is represented with a straight dotted line. The calculated correlation coefficient is equal to 0.77. |
| In the text | |
|
Fig. 6 Molecular fraction f(H2) correlated with equivalent widths of the 5780 and 5797 DIBs normalized with E(B– V). A weak relation only in the case of 5780 DIB is seen (panel a) – shown by the straight dotted line. |
| In the text | |
|
Fig. 7 Equivalent widths of the 5780 and 5797 DIBs correlated with column densities of CH (top panels) and CH+ (bottom). Closer relations are emphasized with the fitted straight lines. 5797 DIB is more closely correlated with N(CH), while 5780 DIB with N(CH+) with correlation coefficients equal to 0.89 and 0.72, respectively. Data points with HD numbers in panels b and c were not used in calculations. If the same data points were also not used in panels a and d, calculated correlation coefficients were equal 0.56 and 0.53, respectively. |
| In the text | |
|
Fig. 8 Correlation plot between column density of H2 and CH molecules with correlation coeffficient equal to 0.95. A fit to data points is presented with dotted line. HD 34078 was not used in calculations. |
| In the text | |
Current usage metrics show cumulative count of Article Views (full-text article views including HTML views, PDF and ePub downloads, according to the available data) and Abstracts Views on Vision4Press platform.
Data correspond to usage on the plateform after 2015. The current usage metrics is available 48-96 hours after online publication and is updated daily on week days.
Initial download of the metrics may take a while.