Fig. 7.
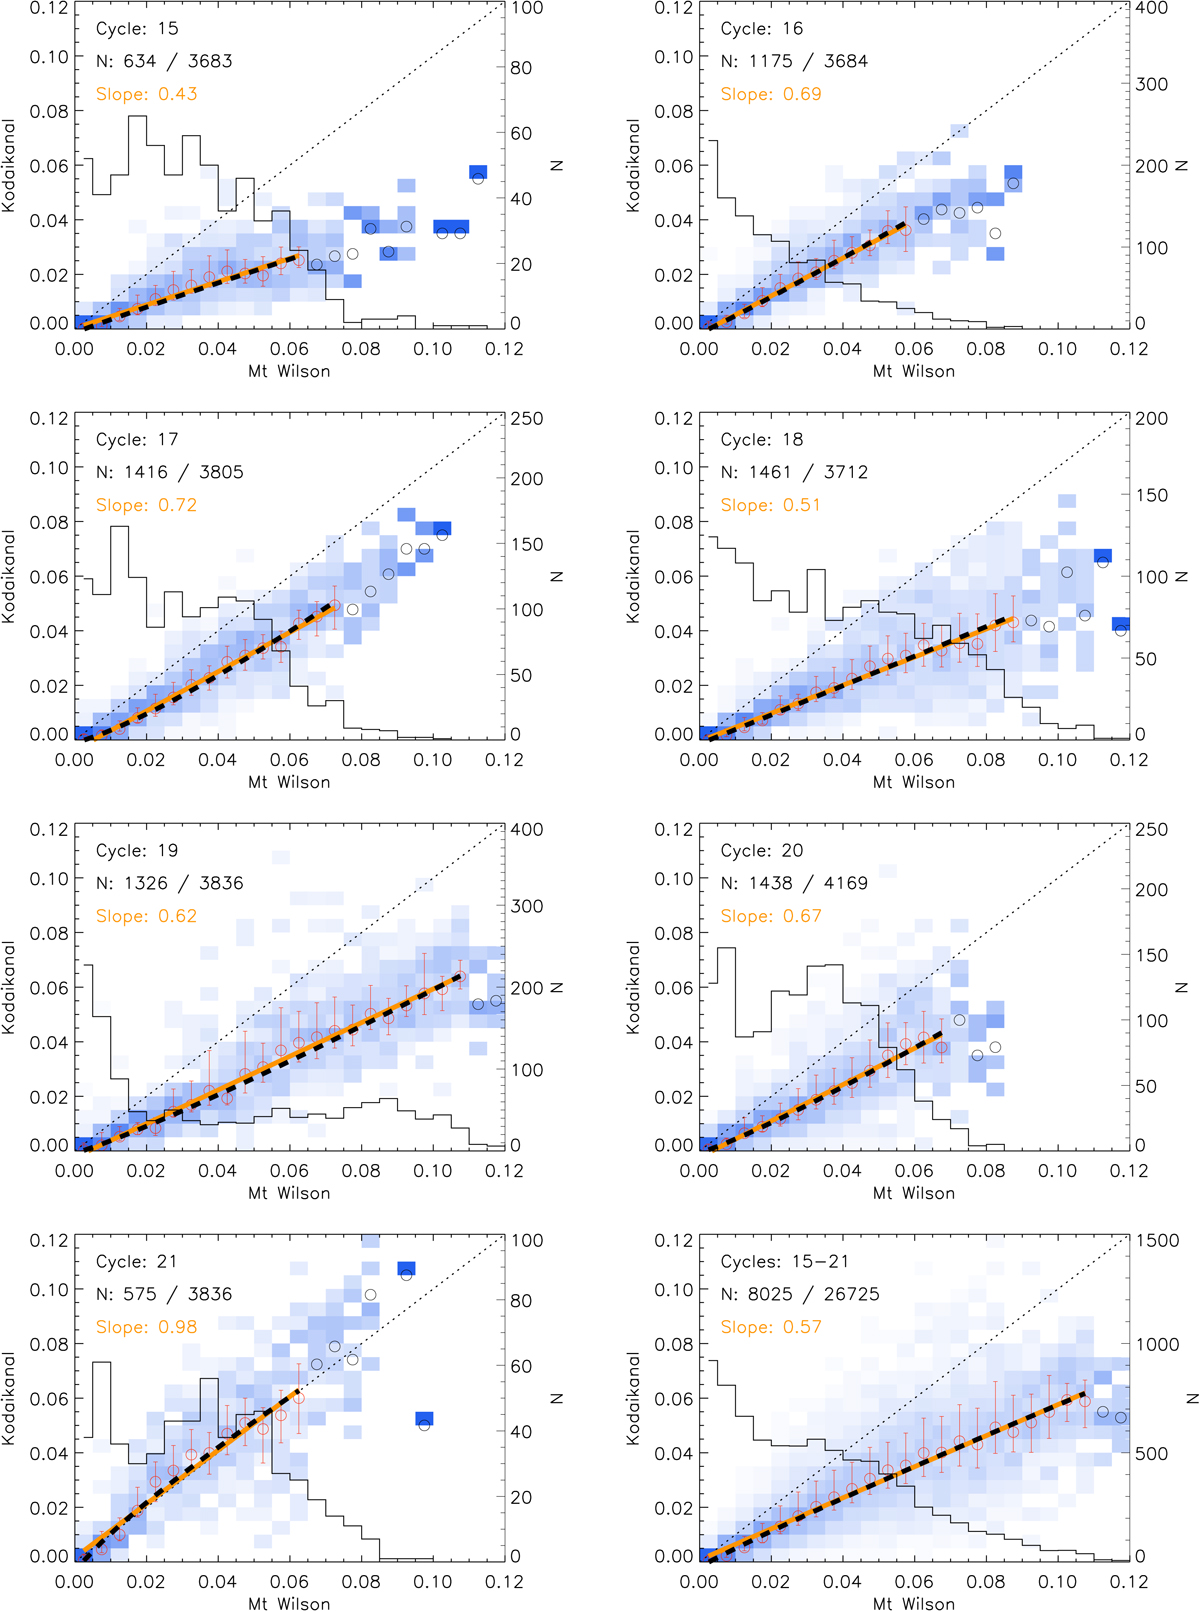
Probability distribution functions for fractional disc coverage by plage derived from Ko data, within area bins of 0.005, as a function of the disc fractions from MW for the same days. The PDFs are colour-coded: white is 0 and bright blue 1. The Ko series is taken as the reference for this particular representation. Circles denote the average value within each column. For columns with less than 20 days of data these circles are shown in black, otherwise in red. We also show the asymmetric 1σ interval for each column. Two different fits to the average values are overplotted; a linear fit (yellow) and a power law fit (black). The number of days included in each column is overplotted with a solid black line (see right-hand axis). The dotted black line has a slope of unity and represents the expectation value. Each panel shows the PDF matrix for a given SC, while the lower right panel is for the whole interval of overlap between the compared series. The number of overlapping days used to construct each matrix (N) and the total number of days within each time interval is written in the plots. The slope of the linear fit is also given.
Current usage metrics show cumulative count of Article Views (full-text article views including HTML views, PDF and ePub downloads, according to the available data) and Abstracts Views on Vision4Press platform.
Data correspond to usage on the plateform after 2015. The current usage metrics is available 48-96 hours after online publication and is updated daily on week days.
Initial download of the metrics may take a while.