Fig. 6.
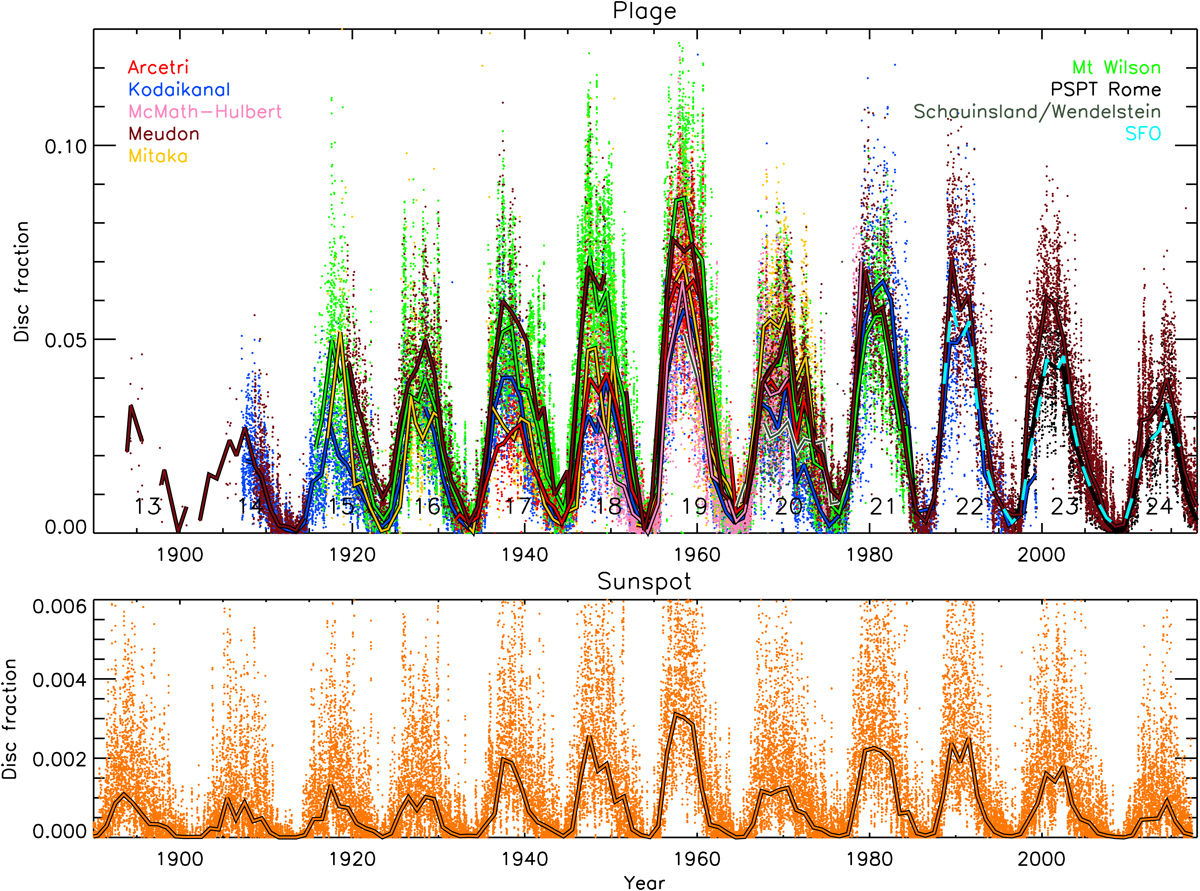
Top panel: fractional disc coverage by plage as a function of time, derived with the NR thresholding scheme applied with the same parameters on images from the archives of Ar (red), Ko (blue), MM (pink), MD (brown), Mi (orange), MW (green), Sc/WS (dark green), and Rome/PSPT (black). Also shown are the plage areas from SFO (light blue). The numbers under the curves denote the conventional SC numbering. Bottom panel: sunspot areas from Balmaceda et al. (2009). Individual small dots represent daily values, while the thick lines indicate annual median values.
Current usage metrics show cumulative count of Article Views (full-text article views including HTML views, PDF and ePub downloads, according to the available data) and Abstracts Views on Vision4Press platform.
Data correspond to usage on the plateform after 2015. The current usage metrics is available 48-96 hours after online publication and is updated daily on week days.
Initial download of the metrics may take a while.