Fig. 4.
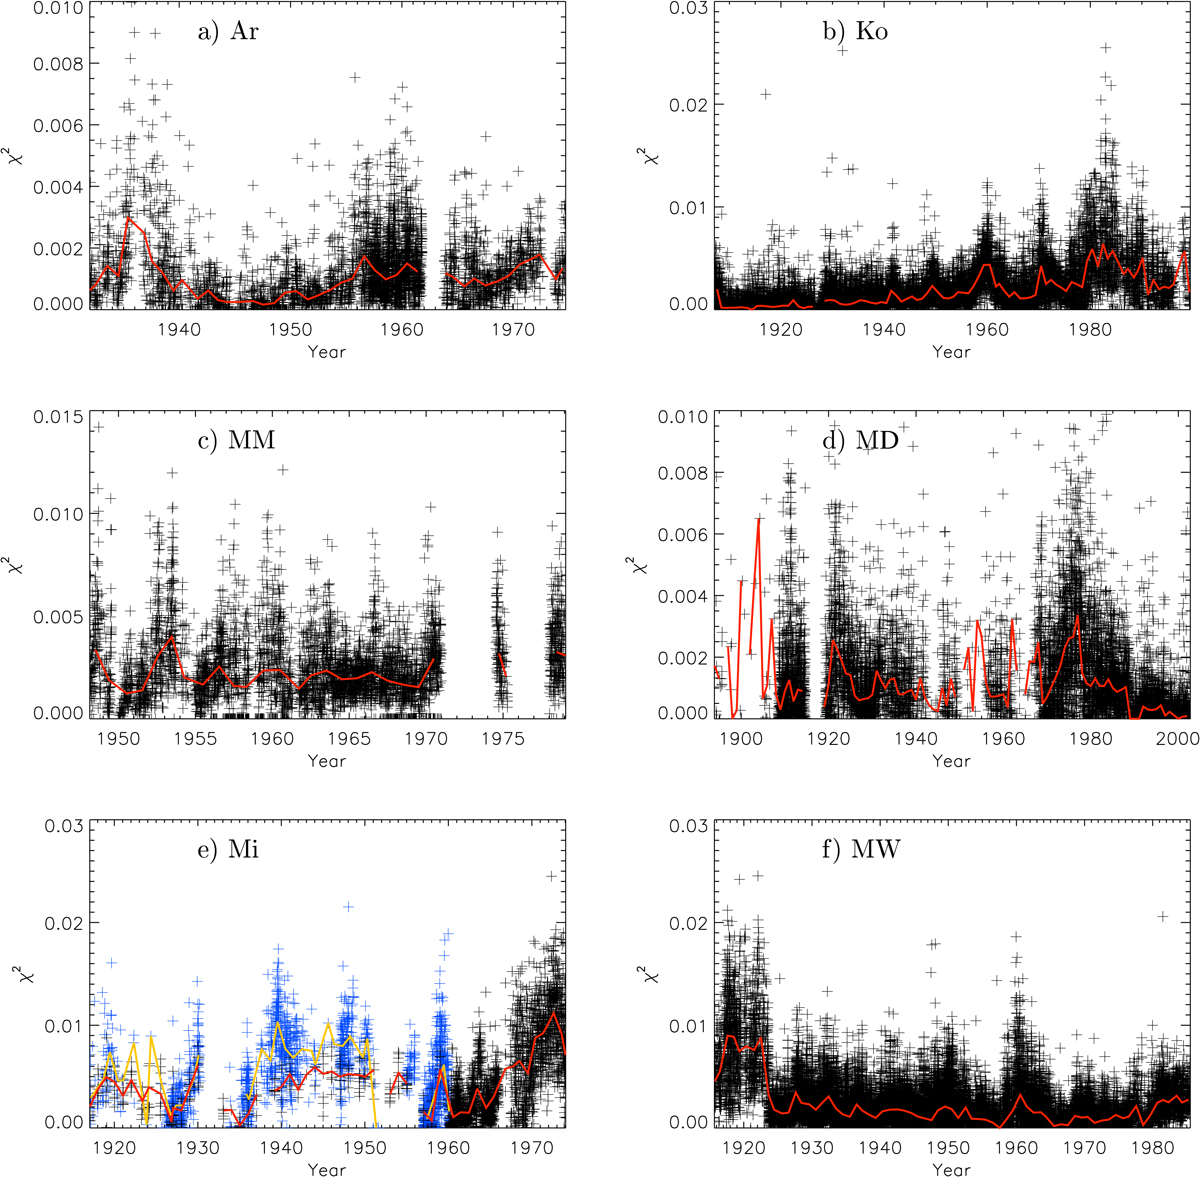
Temporal variation of the reduced χ2 of the fit performed on the QS CLV to determine the CC during the photometric calibration of the images. The values shown here are for all images from the Ar (a), Ko (b), MM (c), MD (d), Mi (e), and MW (f) archives. For Mi we show the values for the images of the earlier (blue) and the more recent (black) digitisations separately. The red solid line shows annual median values (yellow for the earlier Mi digitisation).
Current usage metrics show cumulative count of Article Views (full-text article views including HTML views, PDF and ePub downloads, according to the available data) and Abstracts Views on Vision4Press platform.
Data correspond to usage on the plateform after 2015. The current usage metrics is available 48-96 hours after online publication and is updated daily on week days.
Initial download of the metrics may take a while.