Fig. C.1.
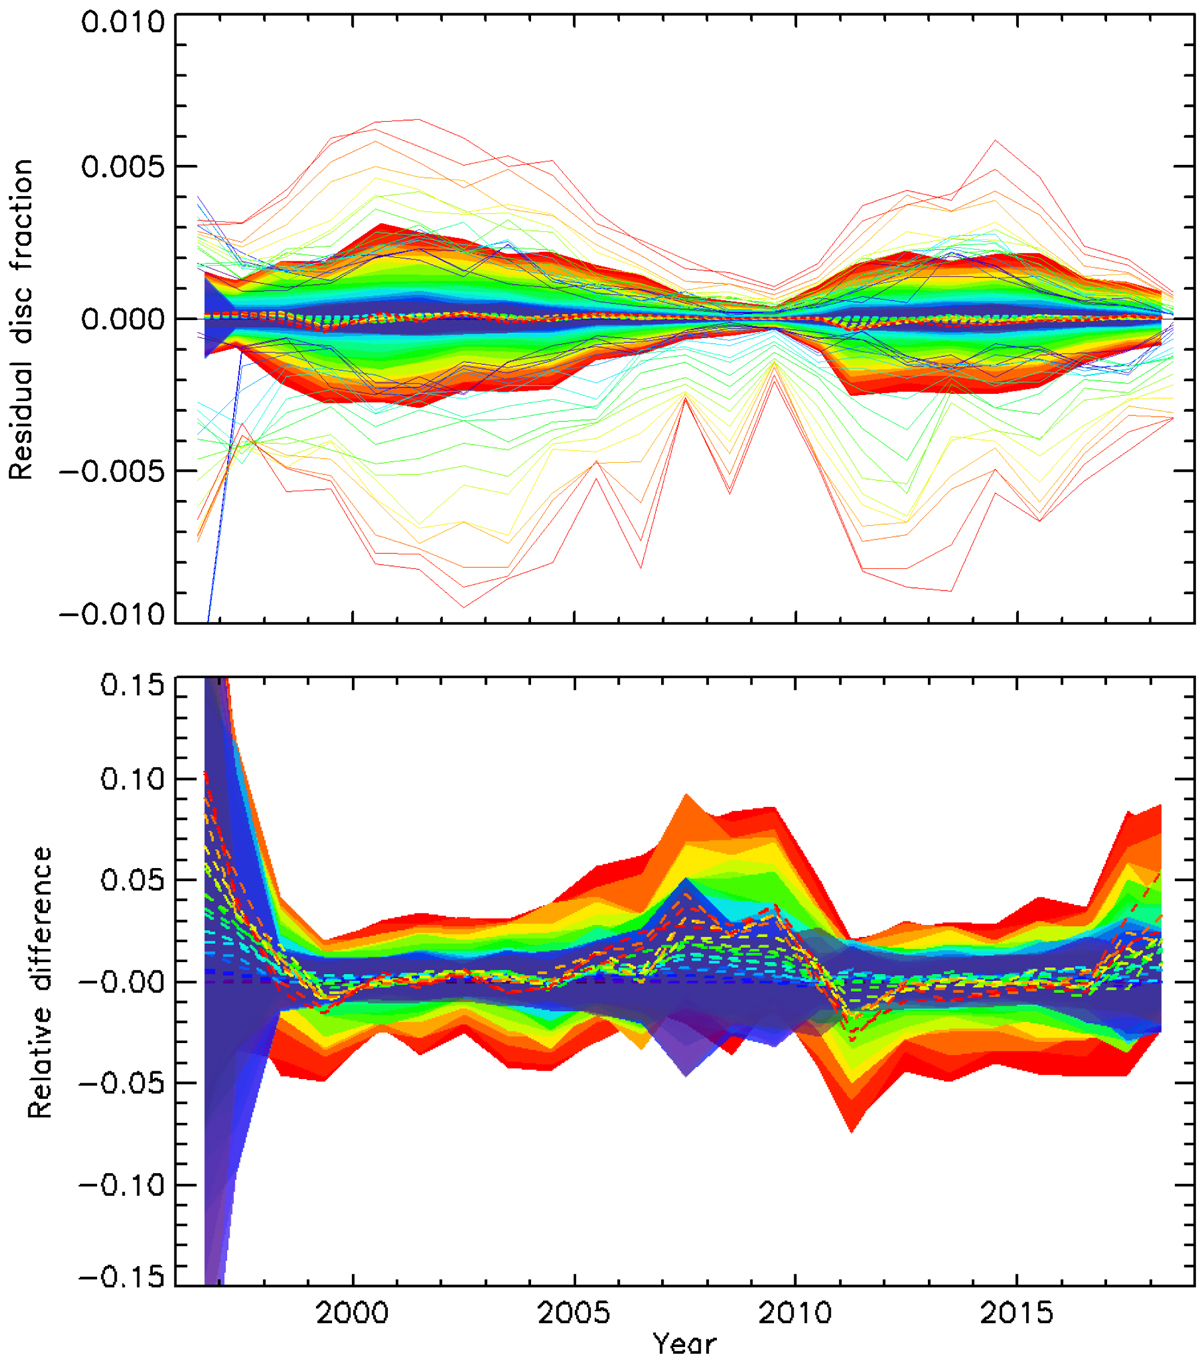
Absolute (top panel) and relative (bottom panel) difference of derived plage areas from images with imposed disc ellipticities to those from the original Rome/PSPT data. Shown are the annual median values (dashed lines), the asymmetric 1σ interval (shaded surfaces), and the annual maximum and minimum values (solid lines). The colours denote results for different disc eccentricities between 0.025 (dark blue) and 0.5 (red).
Current usage metrics show cumulative count of Article Views (full-text article views including HTML views, PDF and ePub downloads, according to the available data) and Abstracts Views on Vision4Press platform.
Data correspond to usage on the plateform after 2015. The current usage metrics is available 48-96 hours after online publication and is updated daily on week days.
Initial download of the metrics may take a while.