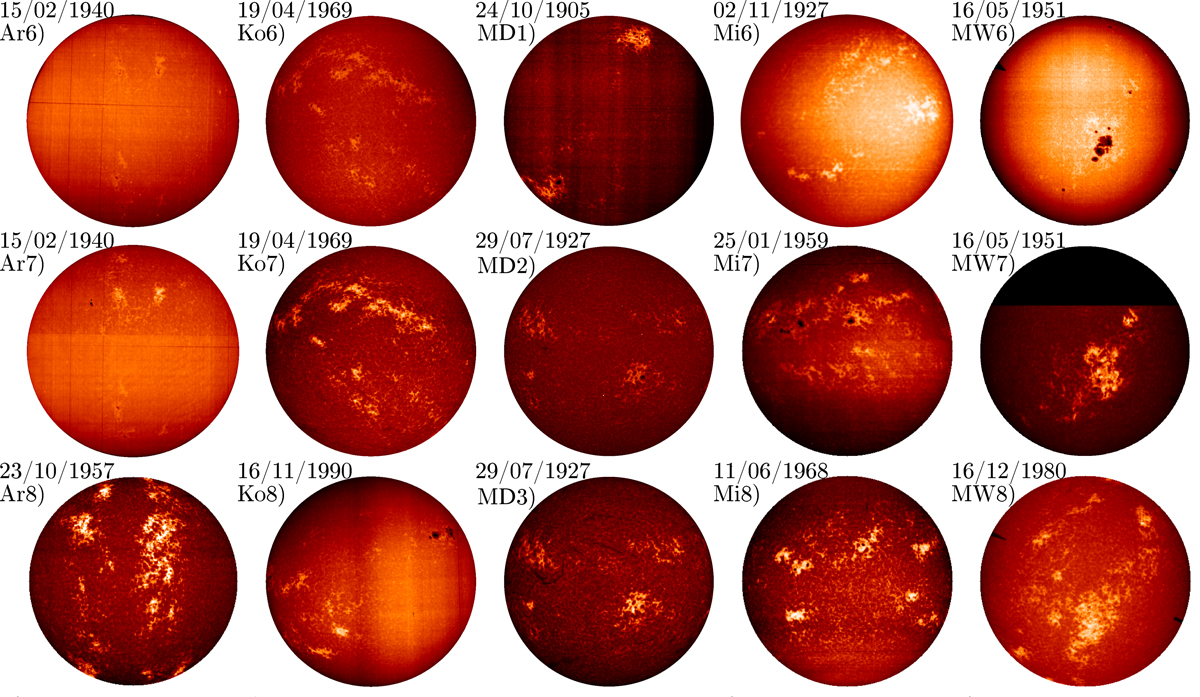
Fig. A.3.

Examples of the diverse images included in the considered historical Ca II K archives to show the different atmospheric heights sampled by the various observations. Shown are raw density images from the archives of Ar, Ko, MD, Mi, and MW. The images are saturated to the range of values within the solar disc. The images are not compensated for ephemeris. Unlike in Figs. 1, 3, and 5, the images from the different observatories do not correspond to the same date.
Current usage metrics show cumulative count of Article Views (full-text article views including HTML views, PDF and ePub downloads, according to the available data) and Abstracts Views on Vision4Press platform.
Data correspond to usage on the plateform after 2015. The current usage metrics is available 48-96 hours after online publication and is updated daily on week days.
Initial download of the metrics may take a while.


