Fig. A.1.
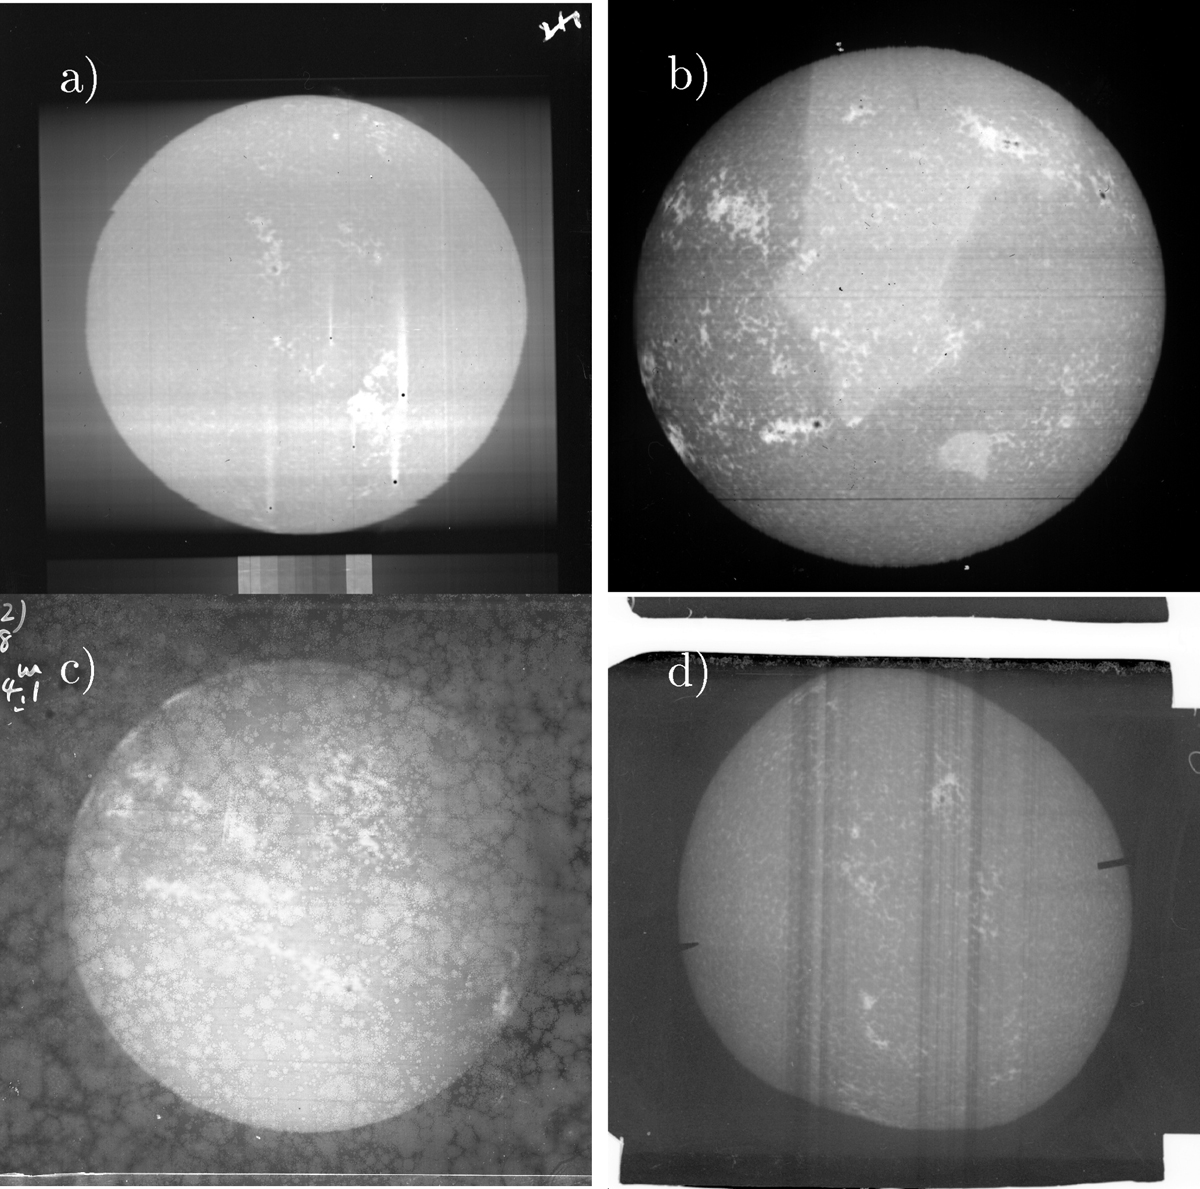
Examples of historical observations that were excluded from this study. Shown are the raw density images. The plotted examples were taken at the (a): Arcetri (21 March 1941), (b): Kodaikanal (18 March 1990), (c): Mitaka (11 April 1948), and (d): Mt Wilson (17 January 1973) observatories. The images are not compensated for solar ephemeris.
Current usage metrics show cumulative count of Article Views (full-text article views including HTML views, PDF and ePub downloads, according to the available data) and Abstracts Views on Vision4Press platform.
Data correspond to usage on the plateform after 2015. The current usage metrics is available 48-96 hours after online publication and is updated daily on week days.
Initial download of the metrics may take a while.