Fig. 17.
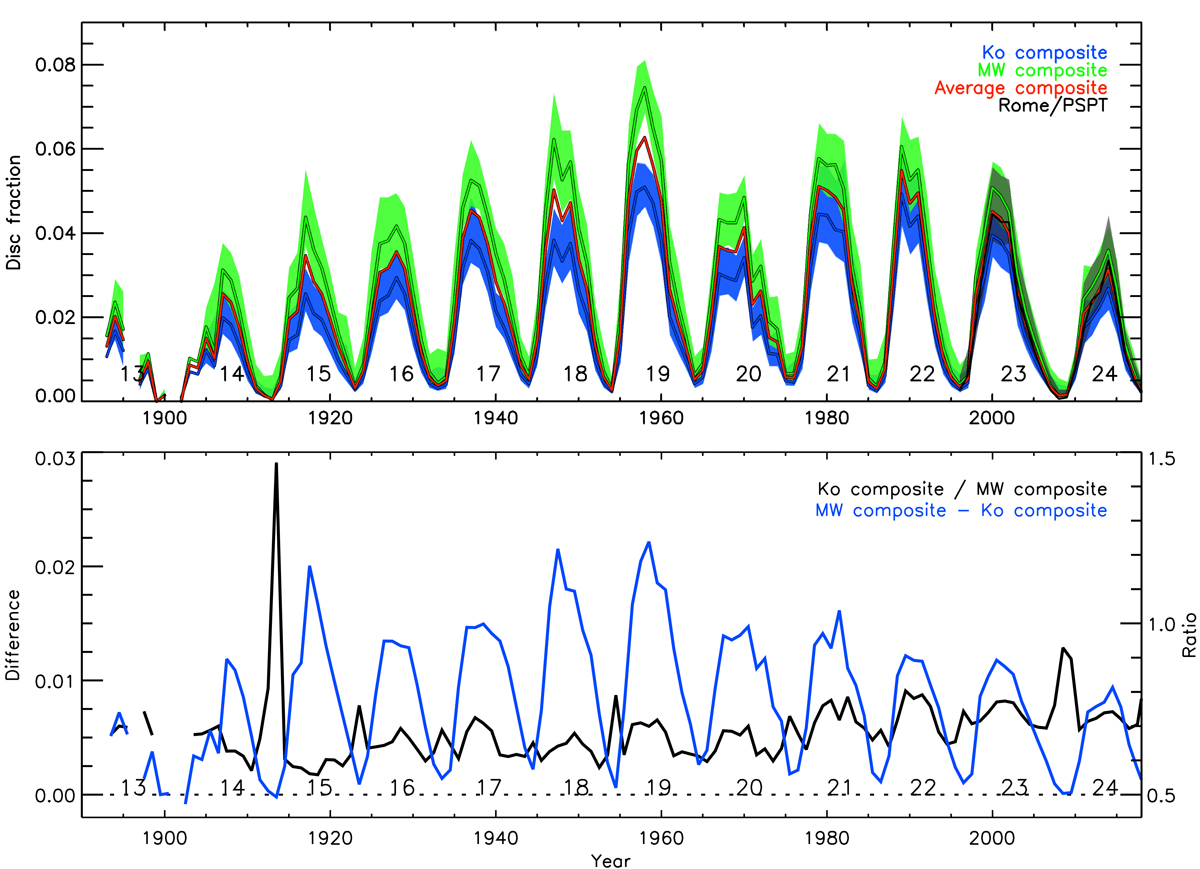
Composites of fractional disc coverage by plage as a function of time (upper panel) using the data from Ko (blue) and MW (green) as the reference. Also shown is the average of the two composites (red), and the unscaled plage areas from Rome/PSPT (black). The shaded surfaces give the asymmetric 1σ interval, while the solid lines are annual median values. Lower panel: ratio (black) and difference (blue) between the annual values of the composites based on the Ko and MW series. The dotted horizontal line denotes the ratio of 0.5 and difference of 0 in disc fractions. The numbers under the curves in both panels denote the conventional SC numbering.
Current usage metrics show cumulative count of Article Views (full-text article views including HTML views, PDF and ePub downloads, according to the available data) and Abstracts Views on Vision4Press platform.
Data correspond to usage on the plateform after 2015. The current usage metrics is available 48-96 hours after online publication and is updated daily on week days.
Initial download of the metrics may take a while.