Fig. 16.
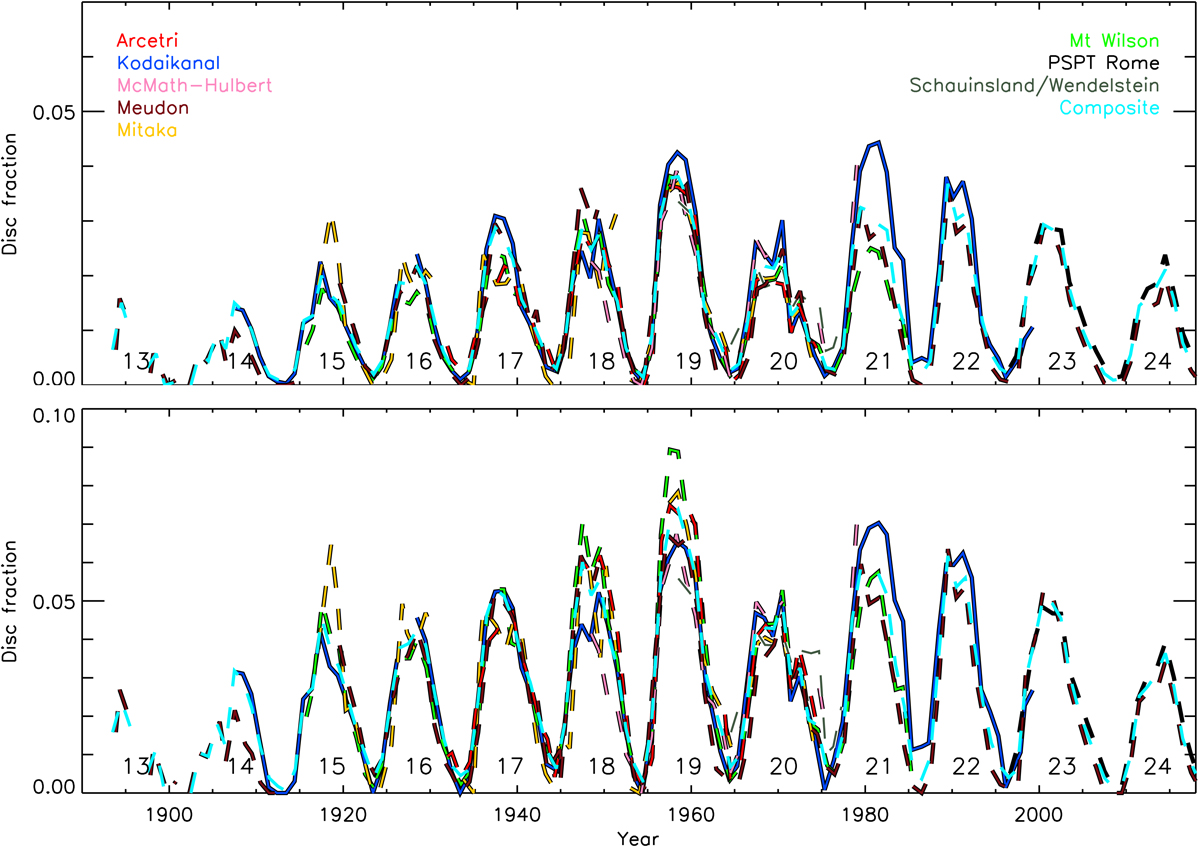
Fractional disc coverage by plage as a function of time, derived by applying the NR method with the same parameters on the images from the Ar (red), Ko (blue), MM (pink), MD (brown), Mi (orange), MW (green), and Sc/WS (dark green) archives after calibration to the plage areas from the Ko (top) and MW (bottom) series. Shown are annual median values. The dashed light blue line is the composite of all calibrated plage series, while the solid black curve is the unscaled plage area series from Rome/PSPT. The numbers under the curves denote the conventional SC numbering.
Current usage metrics show cumulative count of Article Views (full-text article views including HTML views, PDF and ePub downloads, according to the available data) and Abstracts Views on Vision4Press platform.
Data correspond to usage on the plateform after 2015. The current usage metrics is available 48-96 hours after online publication and is updated daily on week days.
Initial download of the metrics may take a while.