Fig. 15.
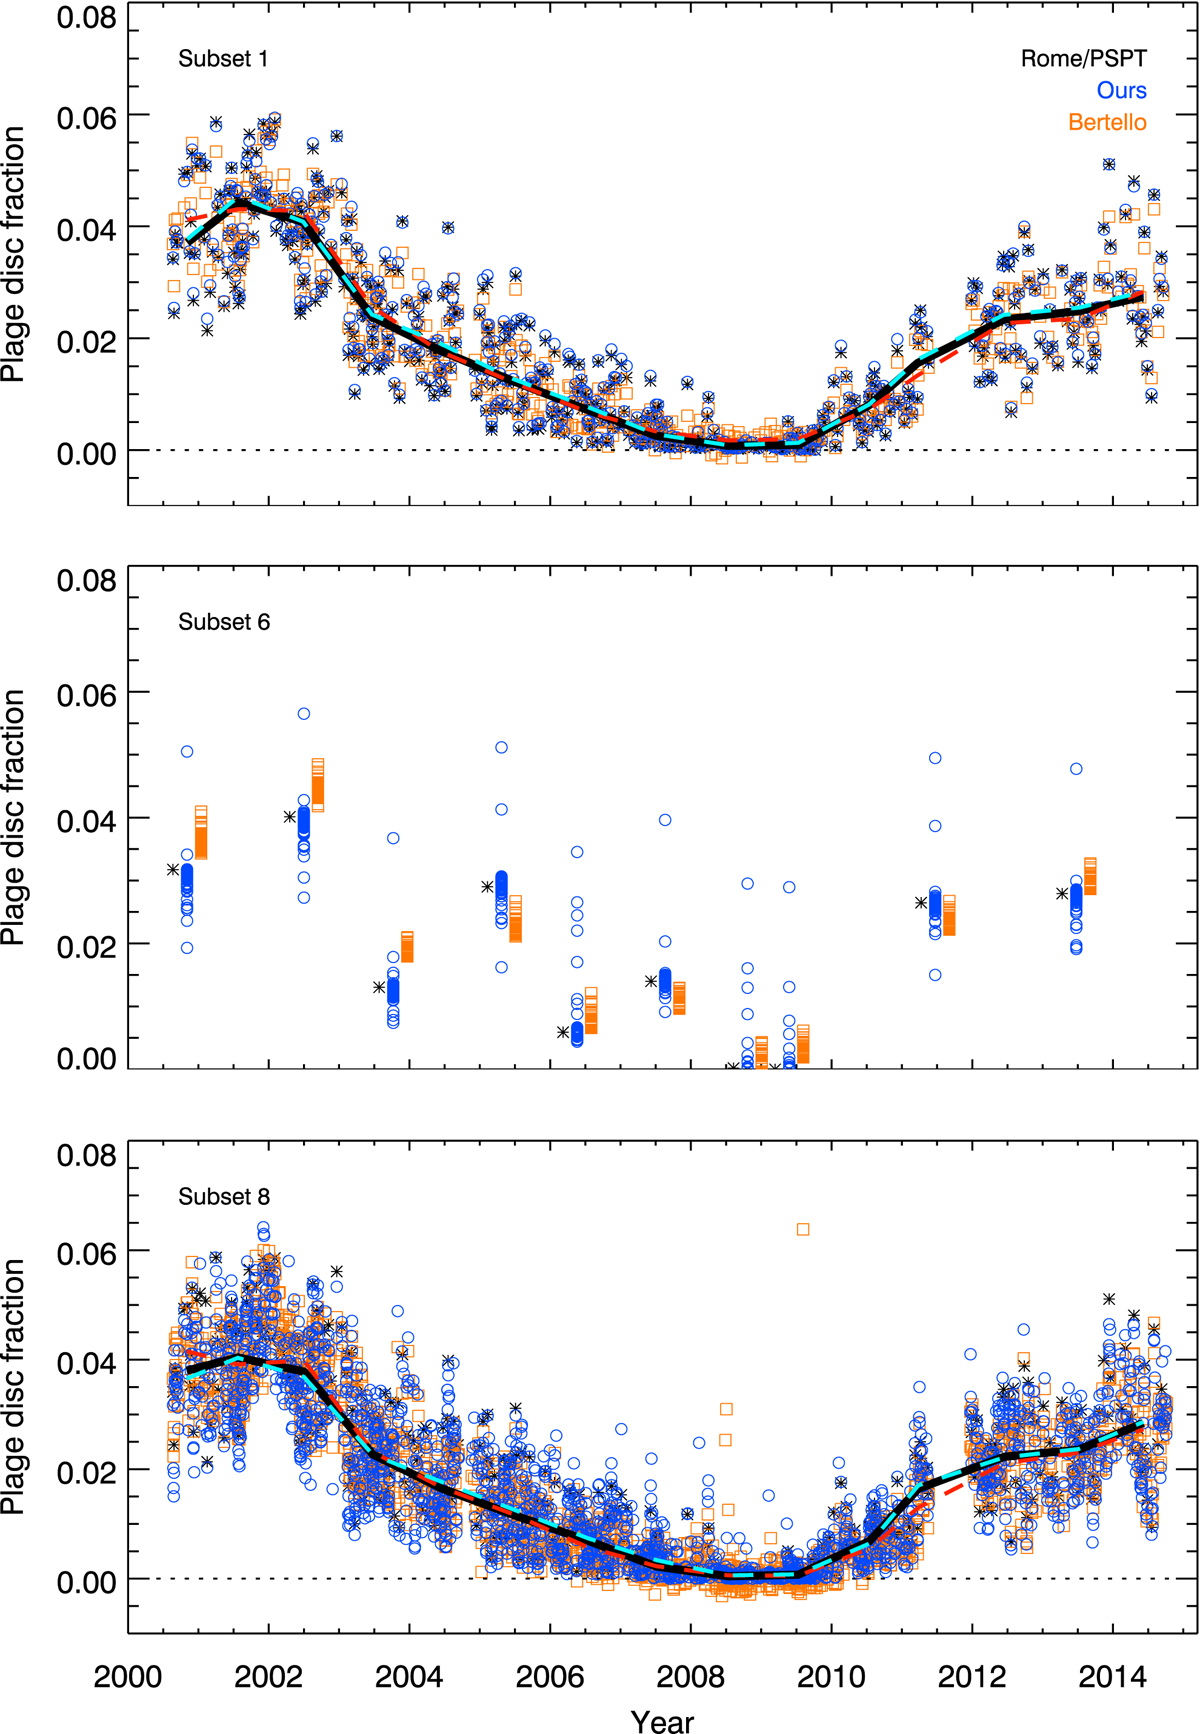
Comparison between plage area disc fractions derived with our method (blue circles) and that by Bertello et al. (2010, orange squares) for subset 1 (top), subset 6 (middle), and subset 8 (bottom). The disc fraction from the original Rome/PSPT data used to create the synthetic images are shown as black asterisks. The blue circles lie almost perfectly over the black asterisks for subset 1. To improve the visibility of the results for subset 6, the plage areas derived with our method and those by Bertello et al. (2010) have been shifted in the x-axis by 0.2 yr and 0.4 yr, respectively. Annual median values are shown for the original Rome/PSPT data (solid black line) and for the synthetic data processed with our method (dashed light blue line) and Bertello et al. (2010, dashed red line). The dotted black horizontal line is for plage area disc fraction of 0. Subset 6 is only available for 10 days during the considered period. The negative values of plage areas obtained with the method by Bertello et al. (2010) are due to the linear scaling applied to match the results to the original Rome/PSPT plage areas, see Sect. 5.2 for more information.
Current usage metrics show cumulative count of Article Views (full-text article views including HTML views, PDF and ePub downloads, according to the available data) and Abstracts Views on Vision4Press platform.
Data correspond to usage on the plateform after 2015. The current usage metrics is available 48-96 hours after online publication and is updated daily on week days.
Initial download of the metrics may take a while.