Fig. 14.
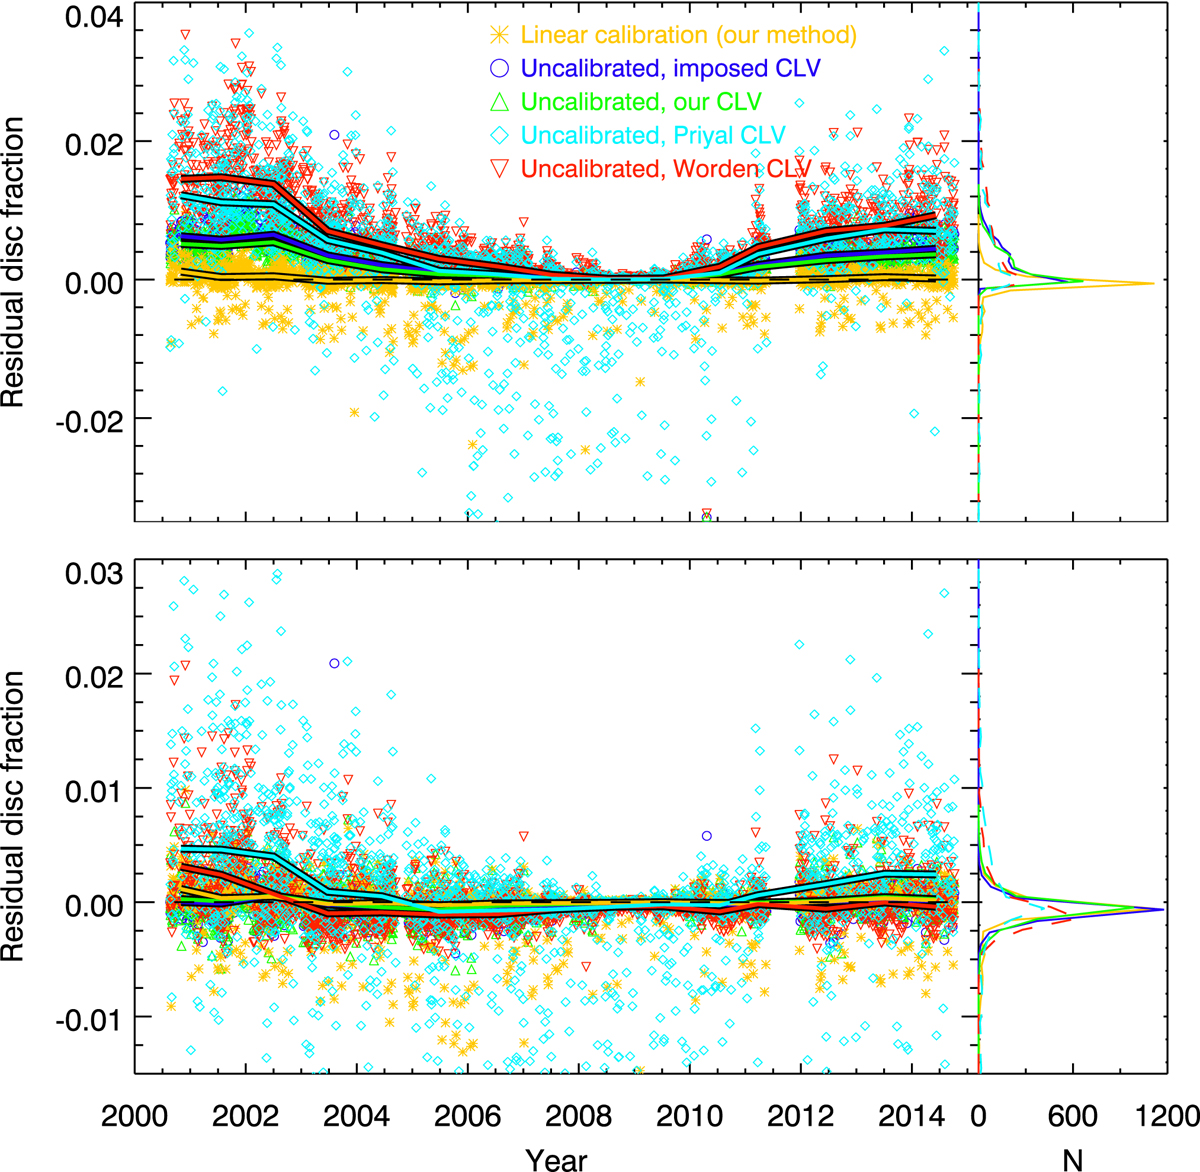
Left plot in each panel: Difference between the fractional disc coverage by plage obtained from the original Rome/PSPT data and from subset 8. The data from subset 8 were processed as follows: linearly calibrated with our method (yellow); uncalibrated, but the imposed CLV was used to remove the CLV (blue); uncalibrated with the CLV removed with our method (green); uncalibrated with the CLV removed following Priyal et al. (2014, light blue); and uncalibrated with the CLV removed following Worden et al. (1998, red). The disc segmentation was done with NR using the same parameters for all cases (top panel) and by adjusting the parameters in each case (except the one for the images calibrated with our method, which is the same in both panels) to match the average disc fractions derived from all original Rome/PSPT data (bottom panel). The solid lines are annual median values of the differences in plage areas to the original Rome/PSPT data. The dashed black horizontal line is for 0 difference. Right plot within each panel: Distribution of the differences shown in the left plots.
Current usage metrics show cumulative count of Article Views (full-text article views including HTML views, PDF and ePub downloads, according to the available data) and Abstracts Views on Vision4Press platform.
Data correspond to usage on the plateform after 2015. The current usage metrics is available 48-96 hours after online publication and is updated daily on week days.
Initial download of the metrics may take a while.