Fig. 12.
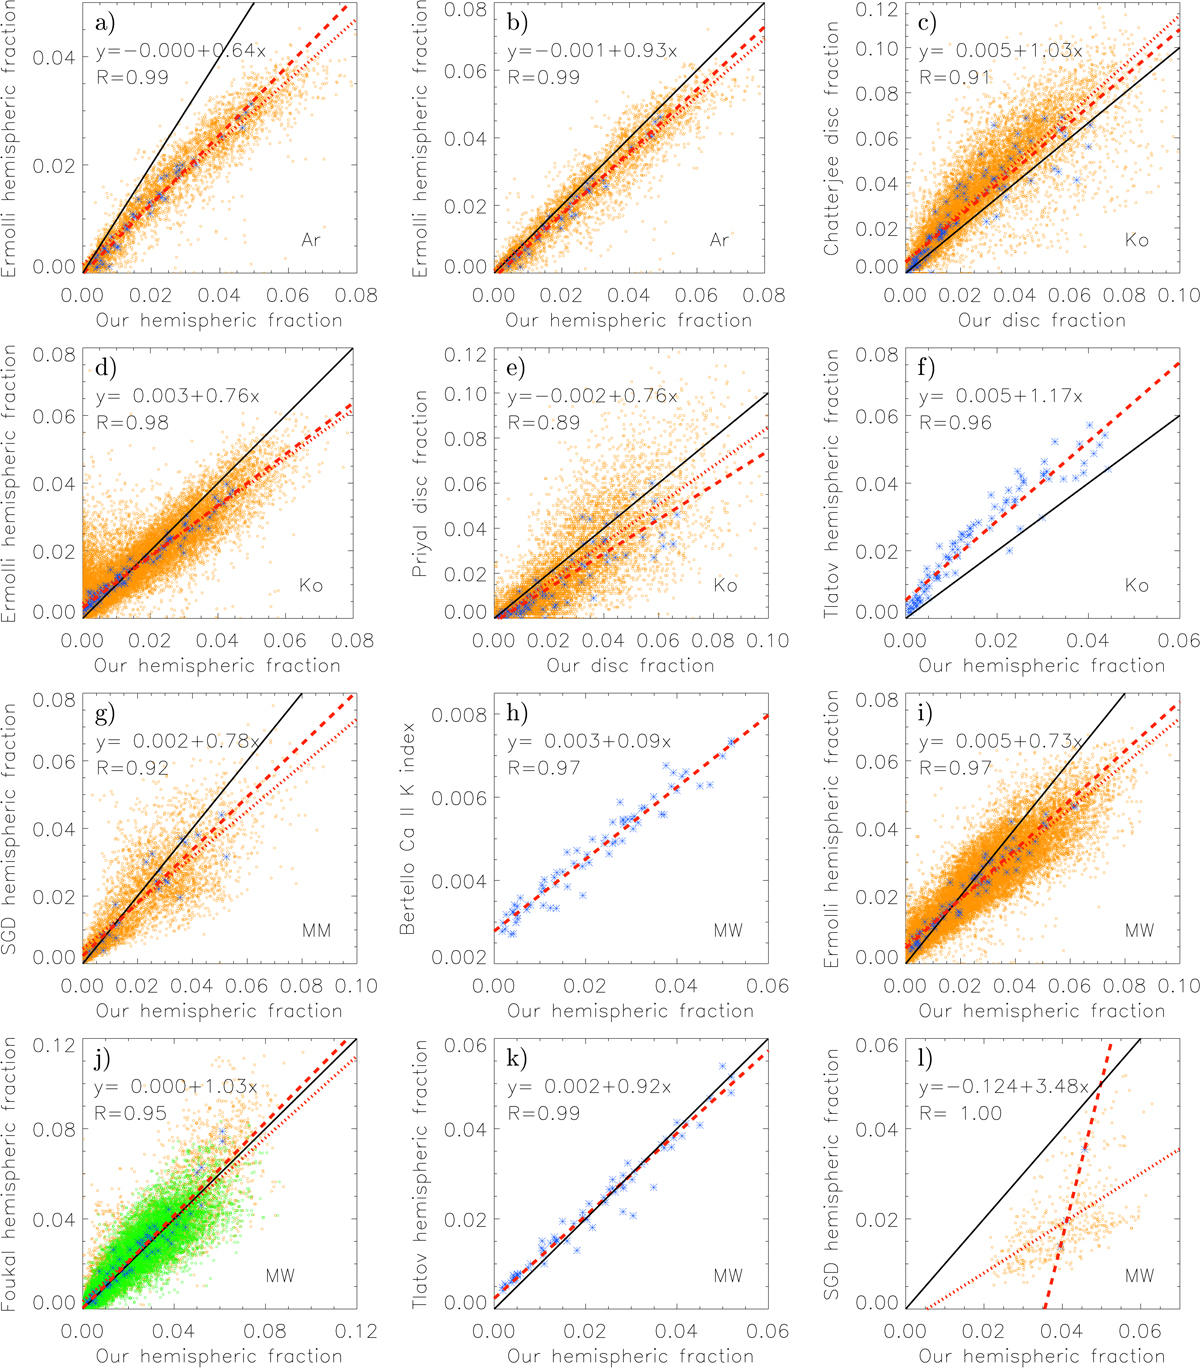
Scatter plots between the plage area values derived by other authors (y-axis) and those obtained here (x-axis): (a): Ermolli et al. 2009a for Ar data; (b): Ermolli et al. (2009b) for Ar data; (c): Chatterjee et al. (2016) for Ko data; (d): Ermolli et al. 2009b for Ko data; (e): Priyal et al. (2017) for Ko data; (f): Tlatov et al. 2009 for Ko data; (g): SGD for MM data; (h): Bertello et al. (2010) for MW data; (i): Ermolli et al. (2009b) for MW data; (j): Foukal (1996) for MW data; (k): Tlatov et al. (2009) for MW data; (l): SGD for MW data. Blue asterisks (orange dots) show the annual (daily) values. In panel i, the green circles show the daily values excluding those from SC 19. The solid black lines have a slope of unity. The dashed (dotted) red lines are linear fits to the annual (daily) data. Also shown are the corresponding parameters of the linear fits to the annual values and the linear correlation coefficients of the annual values.
Current usage metrics show cumulative count of Article Views (full-text article views including HTML views, PDF and ePub downloads, according to the available data) and Abstracts Views on Vision4Press platform.
Data correspond to usage on the plateform after 2015. The current usage metrics is available 48-96 hours after online publication and is updated daily on week days.
Initial download of the metrics may take a while.