Fig. 11.
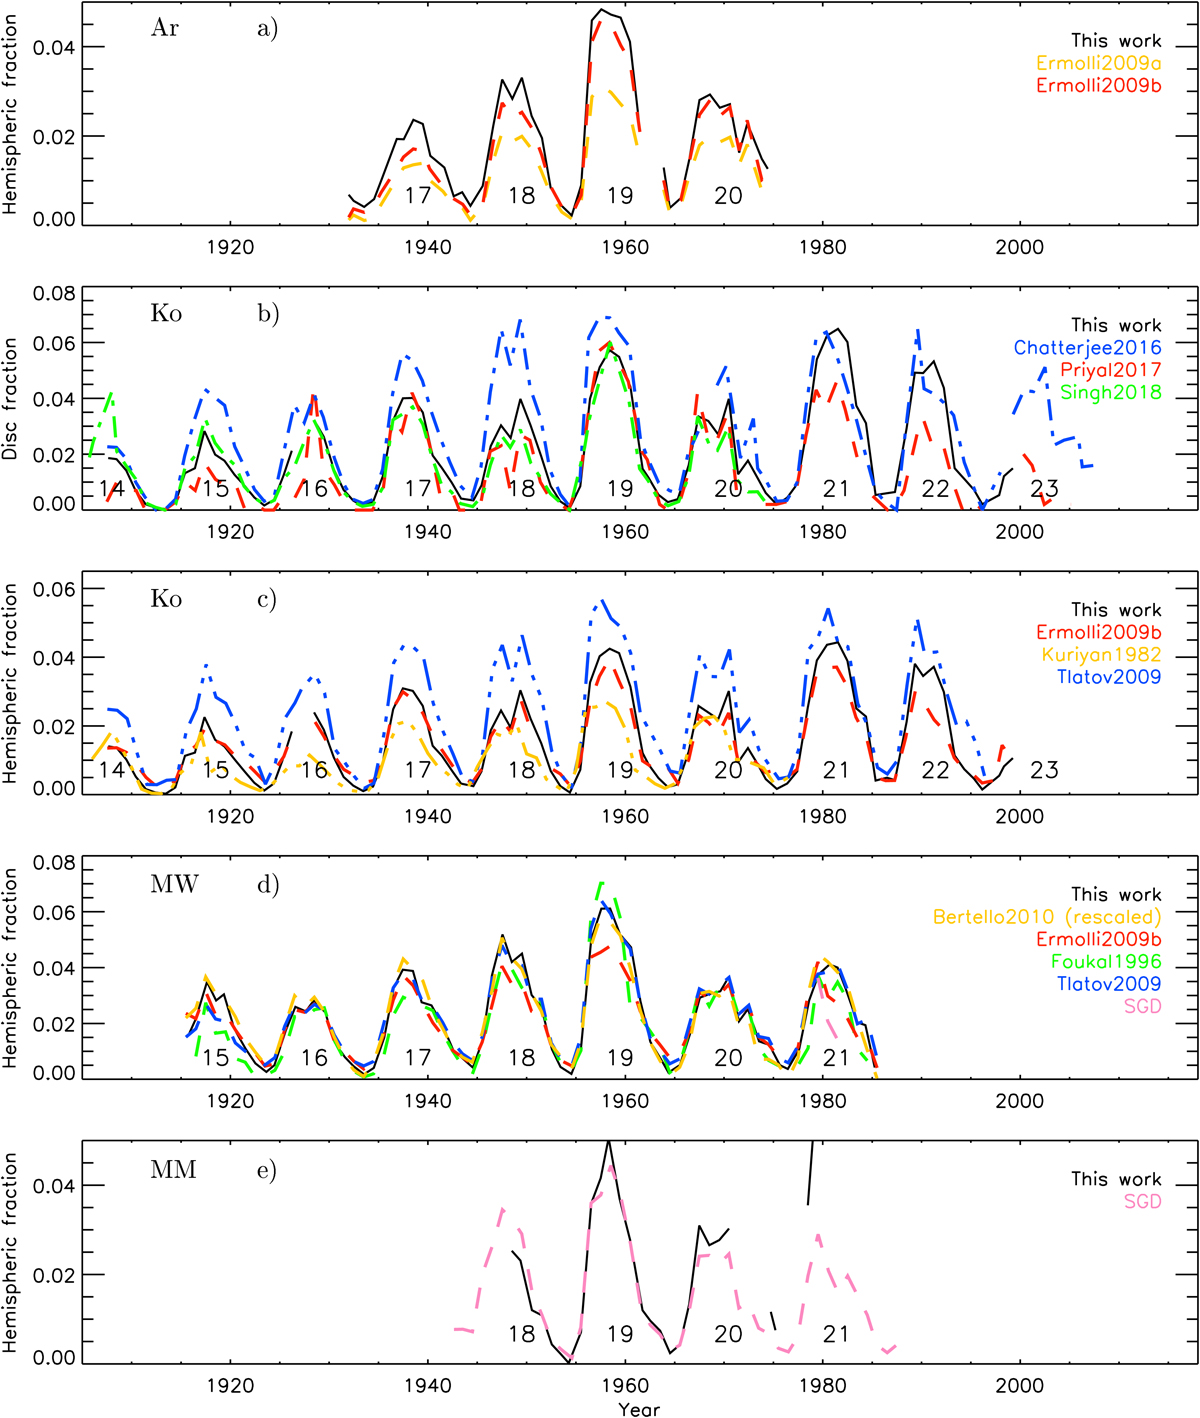
Comparison of the plage areas derived here (black) to other published series based on the same datasets. (a): Ermolli et al. (2009a, yellow) and Ermolli et al. (2009b, red) for Ar data; (b): Chatterjee et al. (2016, blue), Priyal et al. (2017, red), and Singh et al. (2018, green) for Ko areas in disc fractions; (c): Ermolli et al. (2009b, red), Kuriyan et al. (1982, yellow), and Tlatov et al. (2009, blue) for Ko areas in fractions of a hemisphere; (d): Bertello et al. (2010, yellow), Ermolli et al. (2009b, red), Foukal (1996, green), Tlatov et al. (2009, blue), and SGD (pink) for MW data; (e): SGD (pink) for MM data. The curves are annual median values. All panels except (b) are in fractions of hemisphere corrected for projection effects. The numbers under the curves denote the conventional SC numbering.
Current usage metrics show cumulative count of Article Views (full-text article views including HTML views, PDF and ePub downloads, according to the available data) and Abstracts Views on Vision4Press platform.
Data correspond to usage on the plateform after 2015. The current usage metrics is available 48-96 hours after online publication and is updated daily on week days.
Initial download of the metrics may take a while.