Fig. 1.
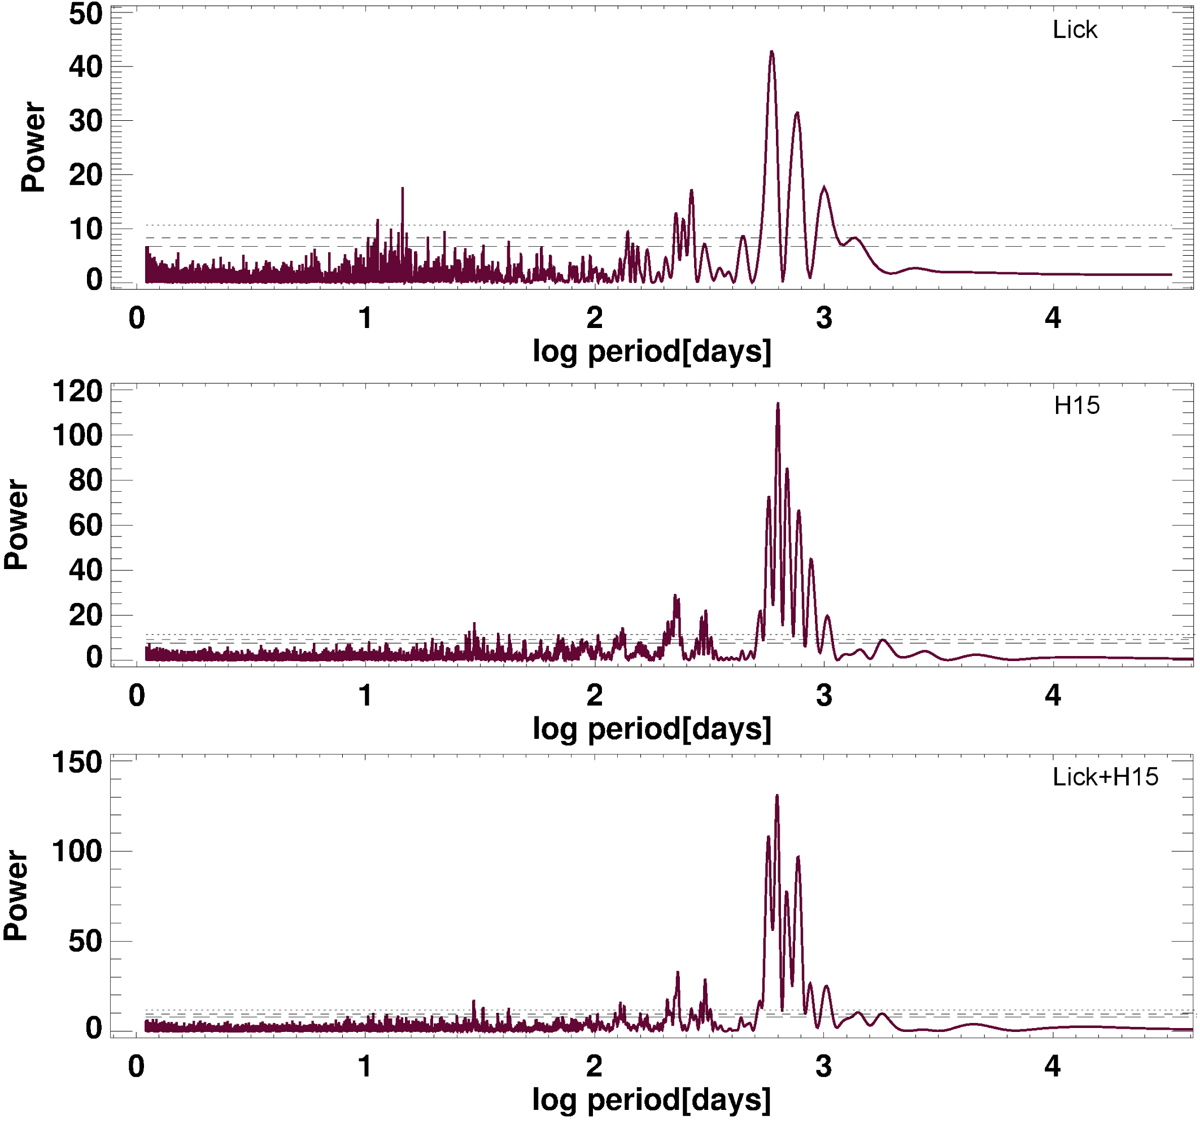
Top: L-S periodogram for the Lick data. The most significant peak is at a period of 587.84 d with a FAP of 1.6 × 10⁻¹⁷. Middle: L-S periodogram for the H15 data. The most significant period is 629.08 d and has a FAP of less than 10−41. Bottom: L-S periodogram for the Lick data combined with the data of H15. The most significant peak is found at a period of 625.02 d with a FAP of less than 10−41. In all three panels, the significance thresholds represented by the vertical dashed lines correspond to FAPs of 0.1%, 1%, and 5%, respectively.
Current usage metrics show cumulative count of Article Views (full-text article views including HTML views, PDF and ePub downloads, according to the available data) and Abstracts Views on Vision4Press platform.
Data correspond to usage on the plateform after 2015. The current usage metrics is available 48-96 hours after online publication and is updated daily on week days.
Initial download of the metrics may take a while.