Fig. 2.
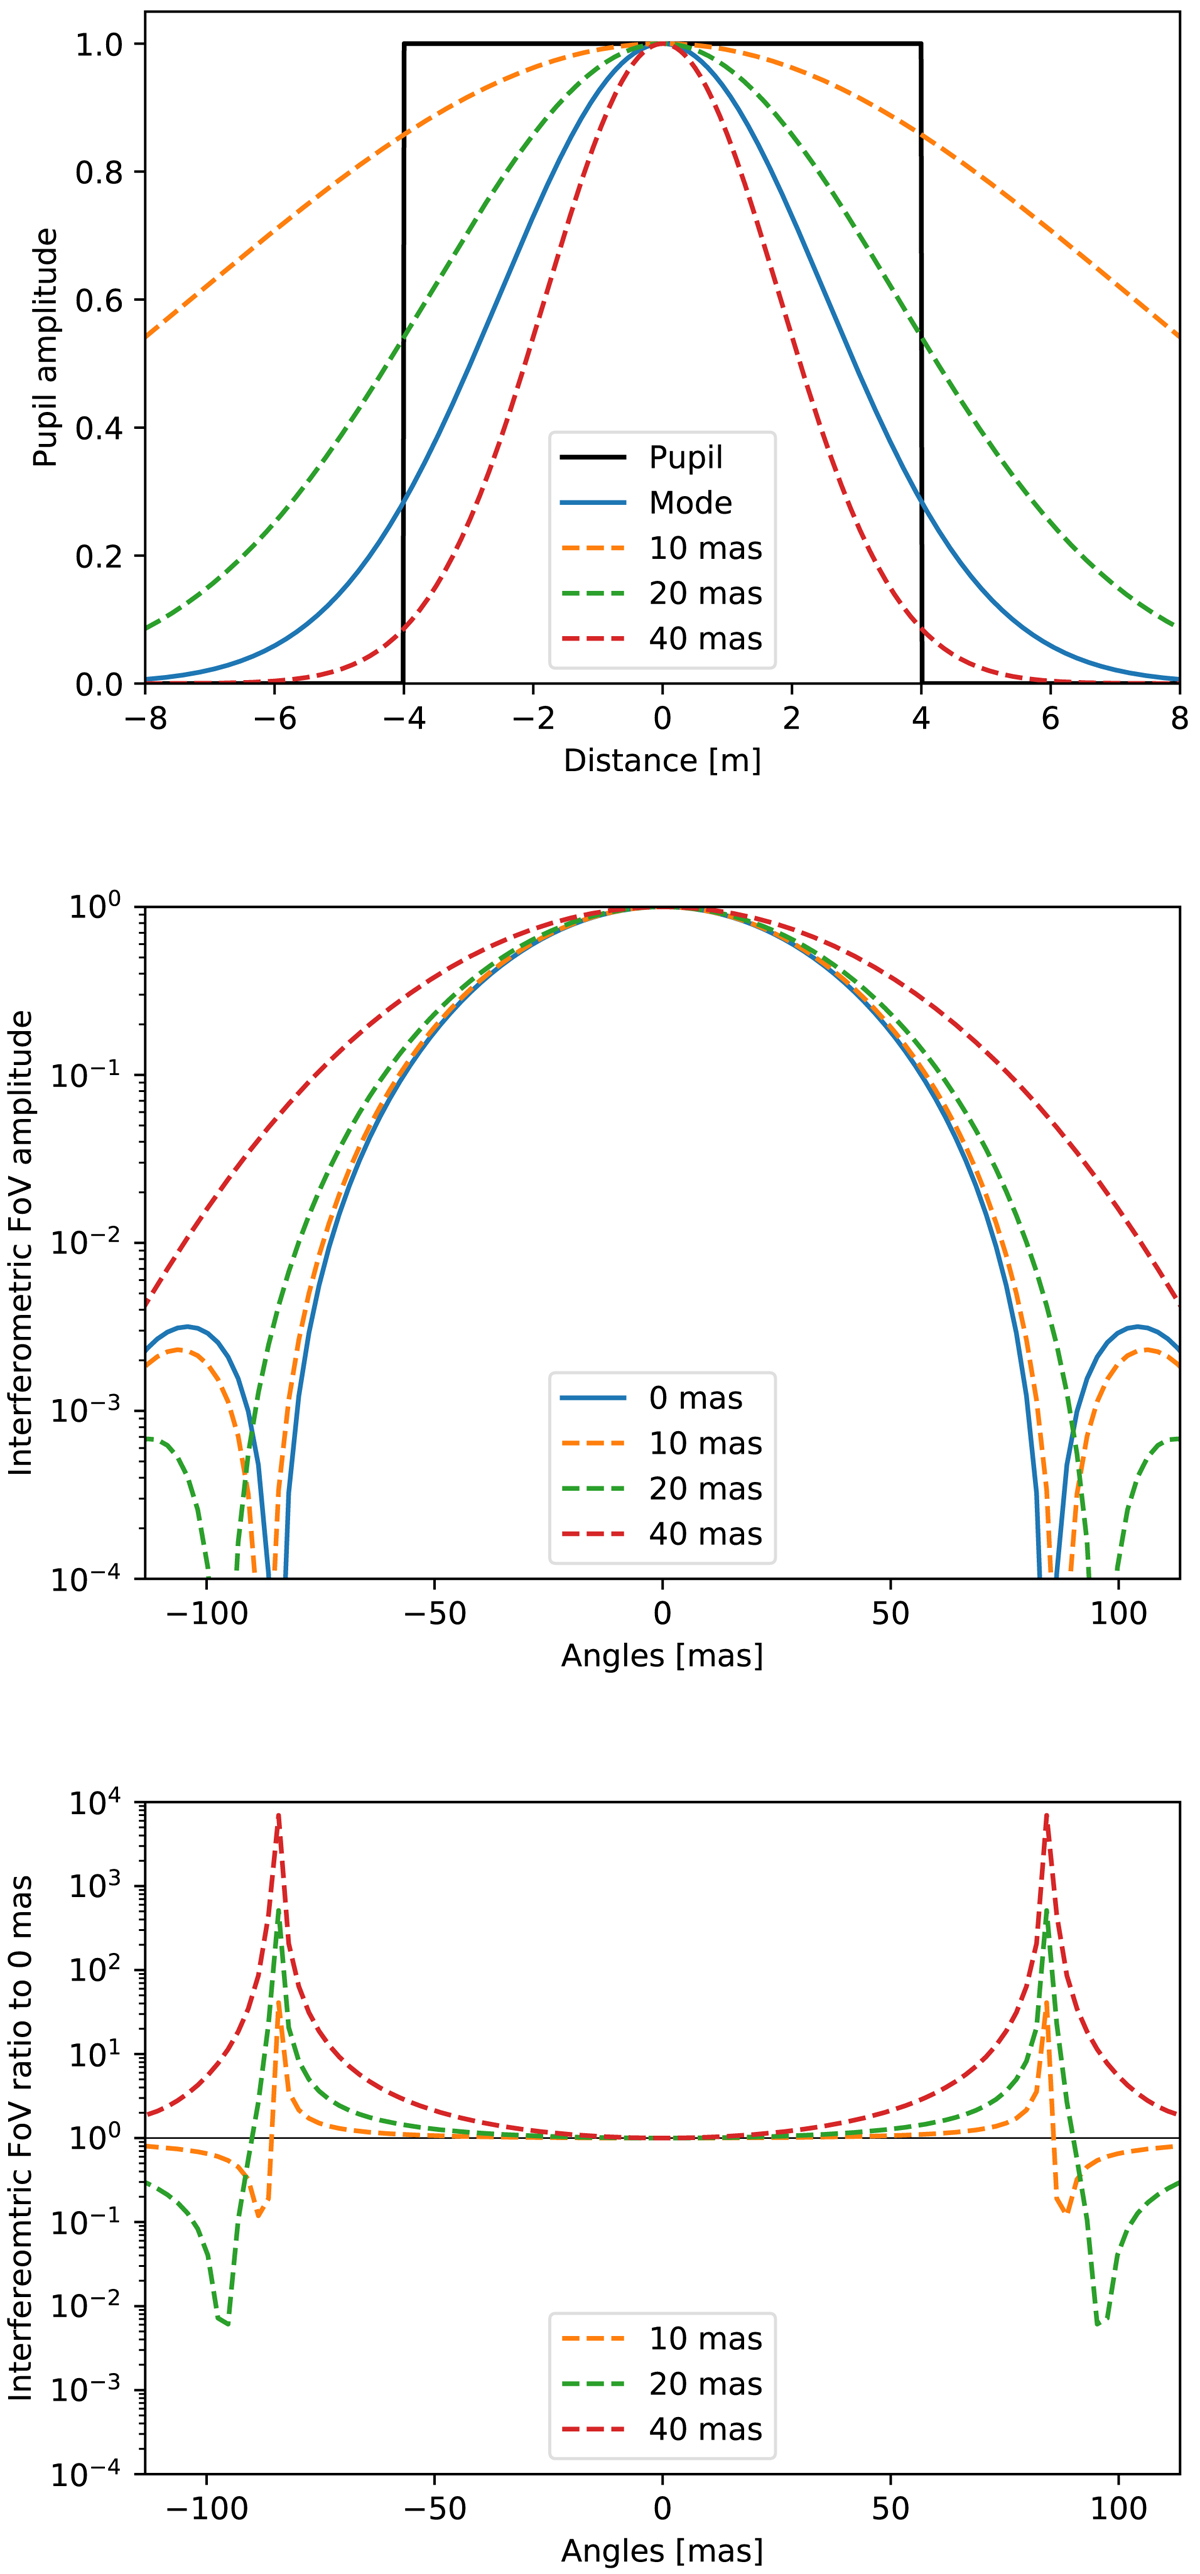
Top: normalised profile in pupil plane of a Gaussian fibre mode (blue) that optimally matches a VLTI/UT-like 8 m telescope pupil (black) where the central obscuration has been neglected. The additional tip-tilt-induced apodisation profiles are given for 10, 20, and 40 mas. The apodisation function is the product of the fibre mode and of the tip-tilt apodisation function. Middle: interferometric lobes for 0 mas, 10, 20, and 40 mas of tip-tilt, shown in logarithmic scale. Each lobe amplitude is normalised on axis and therefore does not illustrate the coupling performance reduction as the tip-tilt perturbation increases. As shown in the text, the photometric lobe matches the interferometric lobe when tip-tilt dominates. Bottom: ratio between the 10, 20, and 40 mas tip-tilt lobes and the lobe without tip-tilt, shown in logarithmic scale. All tip-tilt rms values are for the total tip-tilt in all figures.
Current usage metrics show cumulative count of Article Views (full-text article views including HTML views, PDF and ePub downloads, according to the available data) and Abstracts Views on Vision4Press platform.
Data correspond to usage on the plateform after 2015. The current usage metrics is available 48-96 hours after online publication and is updated daily on week days.
Initial download of the metrics may take a while.