Fig. 10.
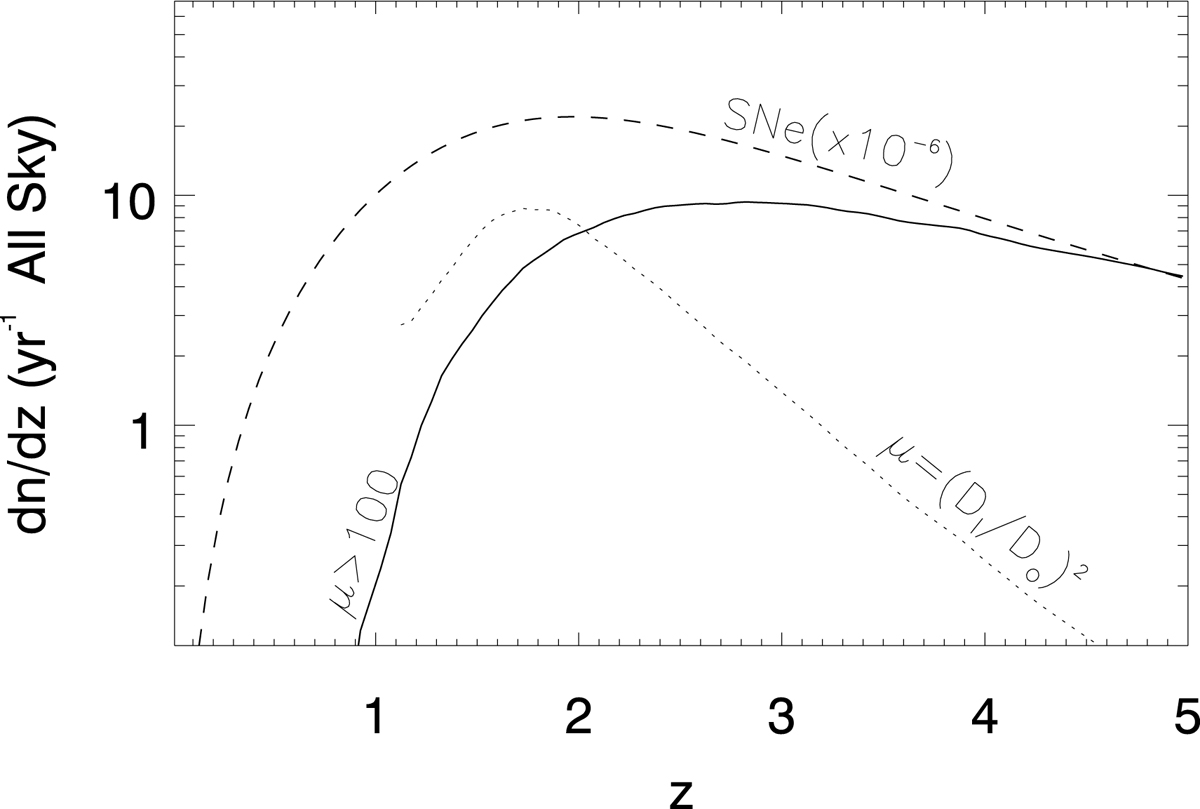
Rate of events (all sky and in the source frame) for a model that traces the star formation rate and normalized to 8 × 10⁻⁵ events per year per Mpc3 (dashed line). The SNe rate has been re-scaled by a factor 106 for presentation purposes. Also shown are the product of the rate times the optical depth for μ > 100 (solid line) and the rate of lensed events with the same apparent magnitude as a similar unlensed event at z = 0.3 (dotted line).
Current usage metrics show cumulative count of Article Views (full-text article views including HTML views, PDF and ePub downloads, according to the available data) and Abstracts Views on Vision4Press platform.
Data correspond to usage on the plateform after 2015. The current usage metrics is available 48-96 hours after online publication and is updated daily on week days.
Initial download of the metrics may take a while.