Free Access
Fig. 8.
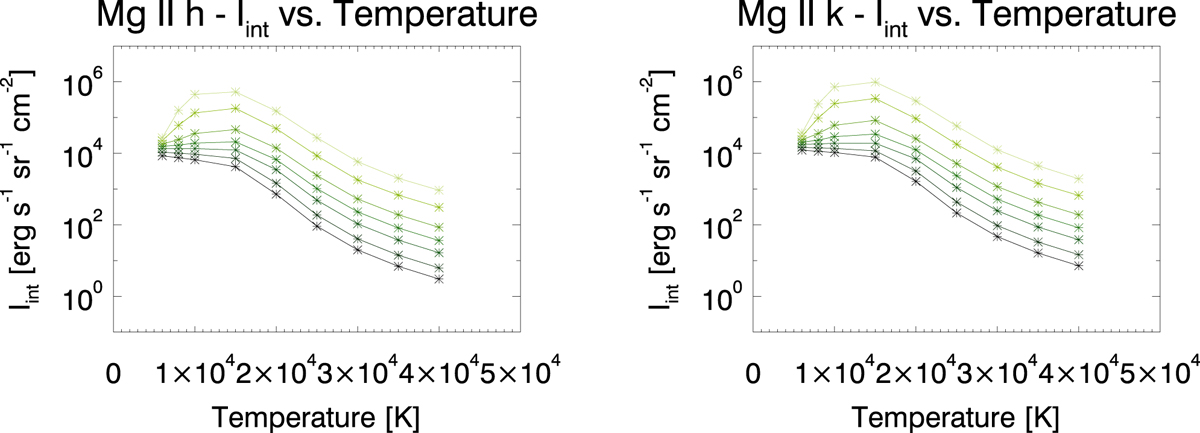
Frequency-integrated intensity against temperature for isothermal isobaric models with D = 1000 km. Colour indicates pressures of (from dark to light) 0.01, 0.02, 0.05, 0.1, 0.2, 0.5, and 1 dyne cm−2. Left: Mg II h. Right: Mg II k.
Current usage metrics show cumulative count of Article Views (full-text article views including HTML views, PDF and ePub downloads, according to the available data) and Abstracts Views on Vision4Press platform.
Data correspond to usage on the plateform after 2015. The current usage metrics is available 48-96 hours after online publication and is updated daily on week days.
Initial download of the metrics may take a while.