Fig. 6.
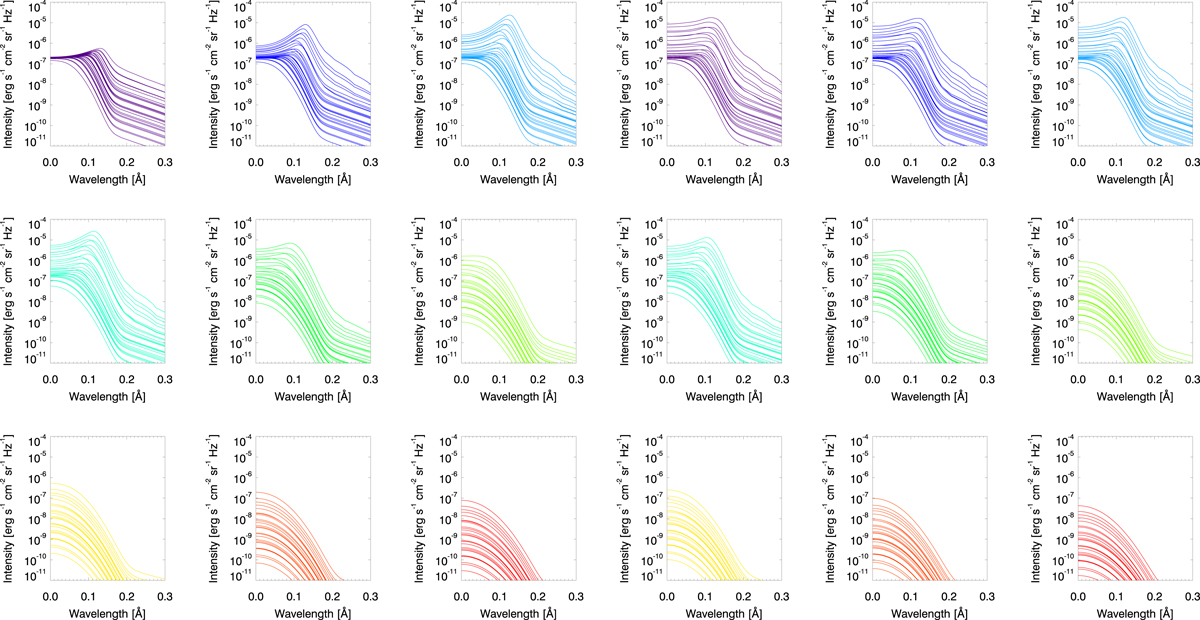
Emergent half-line Mg II k profiles. The first three columns show isothermal isobaric models; the last three columns show PCTR models with γ = 2. Each panel is colour-coded to show a different temperature: 6000 K (purple), 8000 K (dark blue), 10 000 K (light blue), 15 000 K (teal), 20 000 K (green), 25 000 K (lime green), 30 000 K (yellow), 35 000 K (orange), and 40 000 K (red). Intensities generally increase for higher pressure and slab thickness.
Current usage metrics show cumulative count of Article Views (full-text article views including HTML views, PDF and ePub downloads, according to the available data) and Abstracts Views on Vision4Press platform.
Data correspond to usage on the plateform after 2015. The current usage metrics is available 48-96 hours after online publication and is updated daily on week days.
Initial download of the metrics may take a while.