Free Access
Fig. 2.
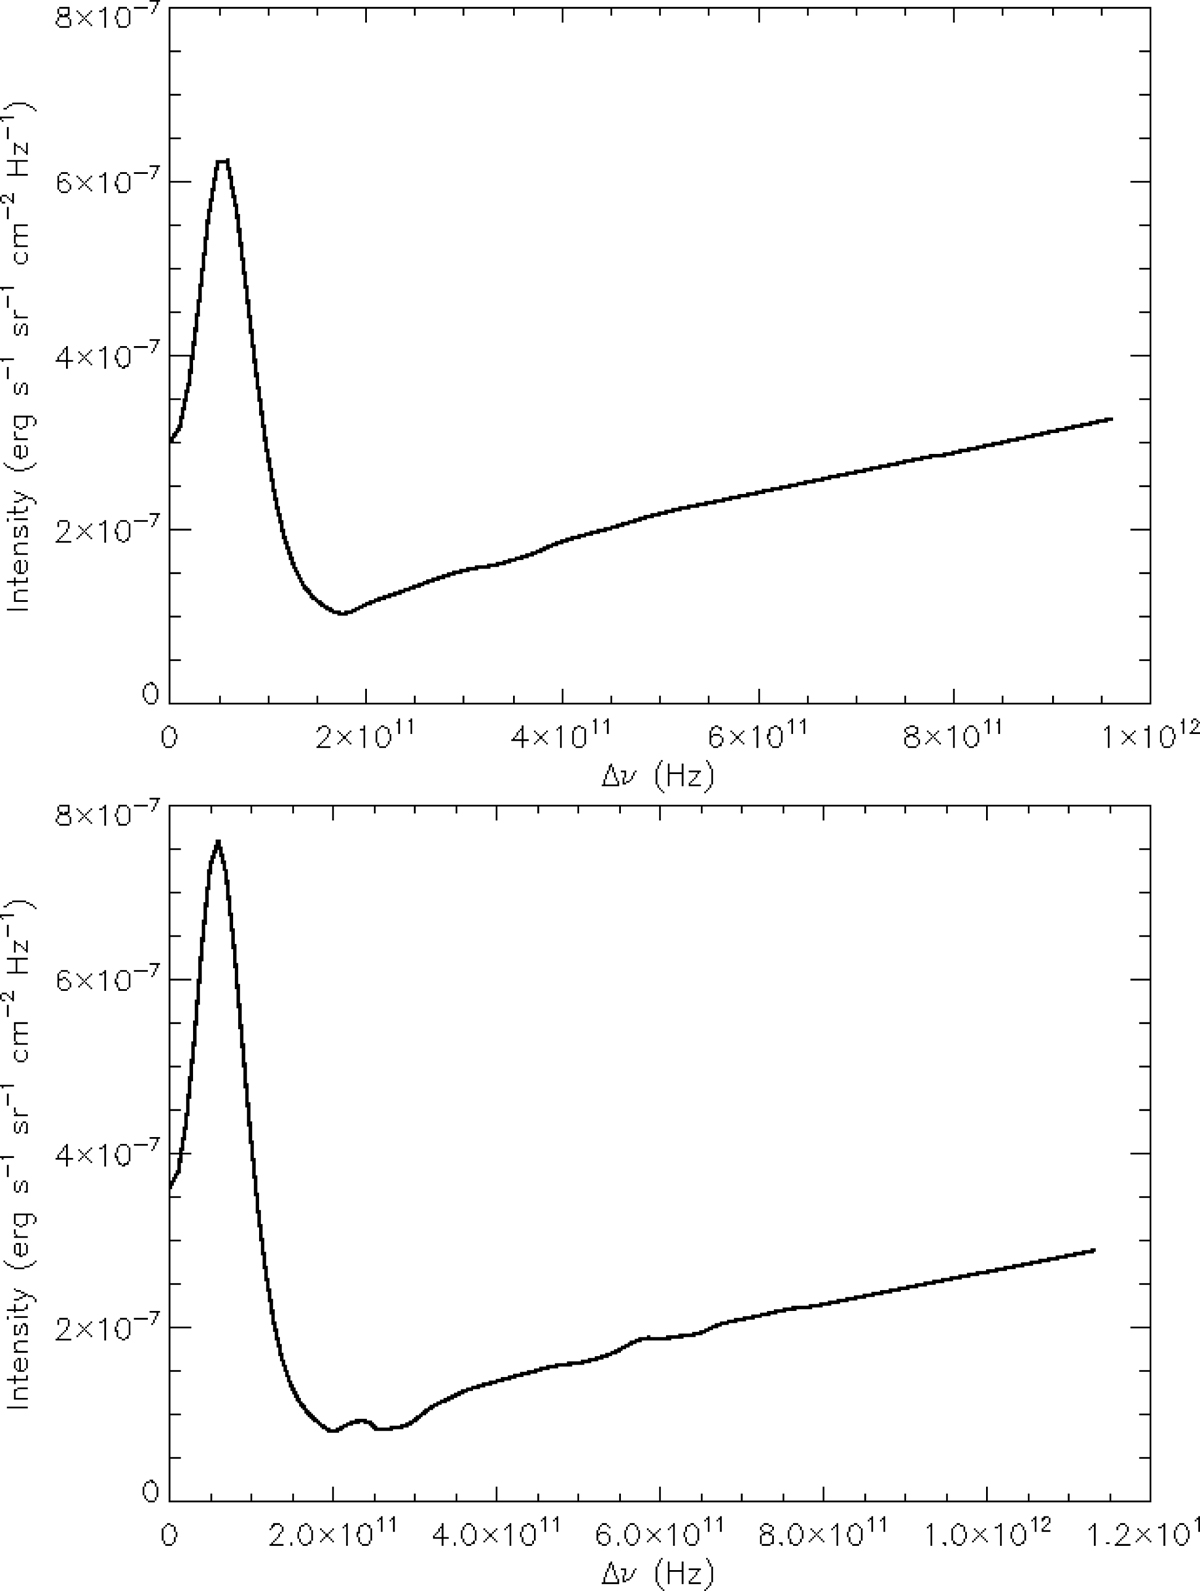
Incident half line profiles for Mg II h (top) and k (bottom) lines. Line cores (Δν ∼ 0−2 × 10¹¹ Hz) are the average of the blue and red sides of the profile only. Above Δν ∼ 2 × 10¹¹ Hz profiles are averaged and smoothed. Absorption lines in the far wings are removed by interpolating between points in the continuum.
Current usage metrics show cumulative count of Article Views (full-text article views including HTML views, PDF and ePub downloads, according to the available data) and Abstracts Views on Vision4Press platform.
Data correspond to usage on the plateform after 2015. The current usage metrics is available 48-96 hours after online publication and is updated daily on week days.
Initial download of the metrics may take a while.