Free Access
Fig. 12.
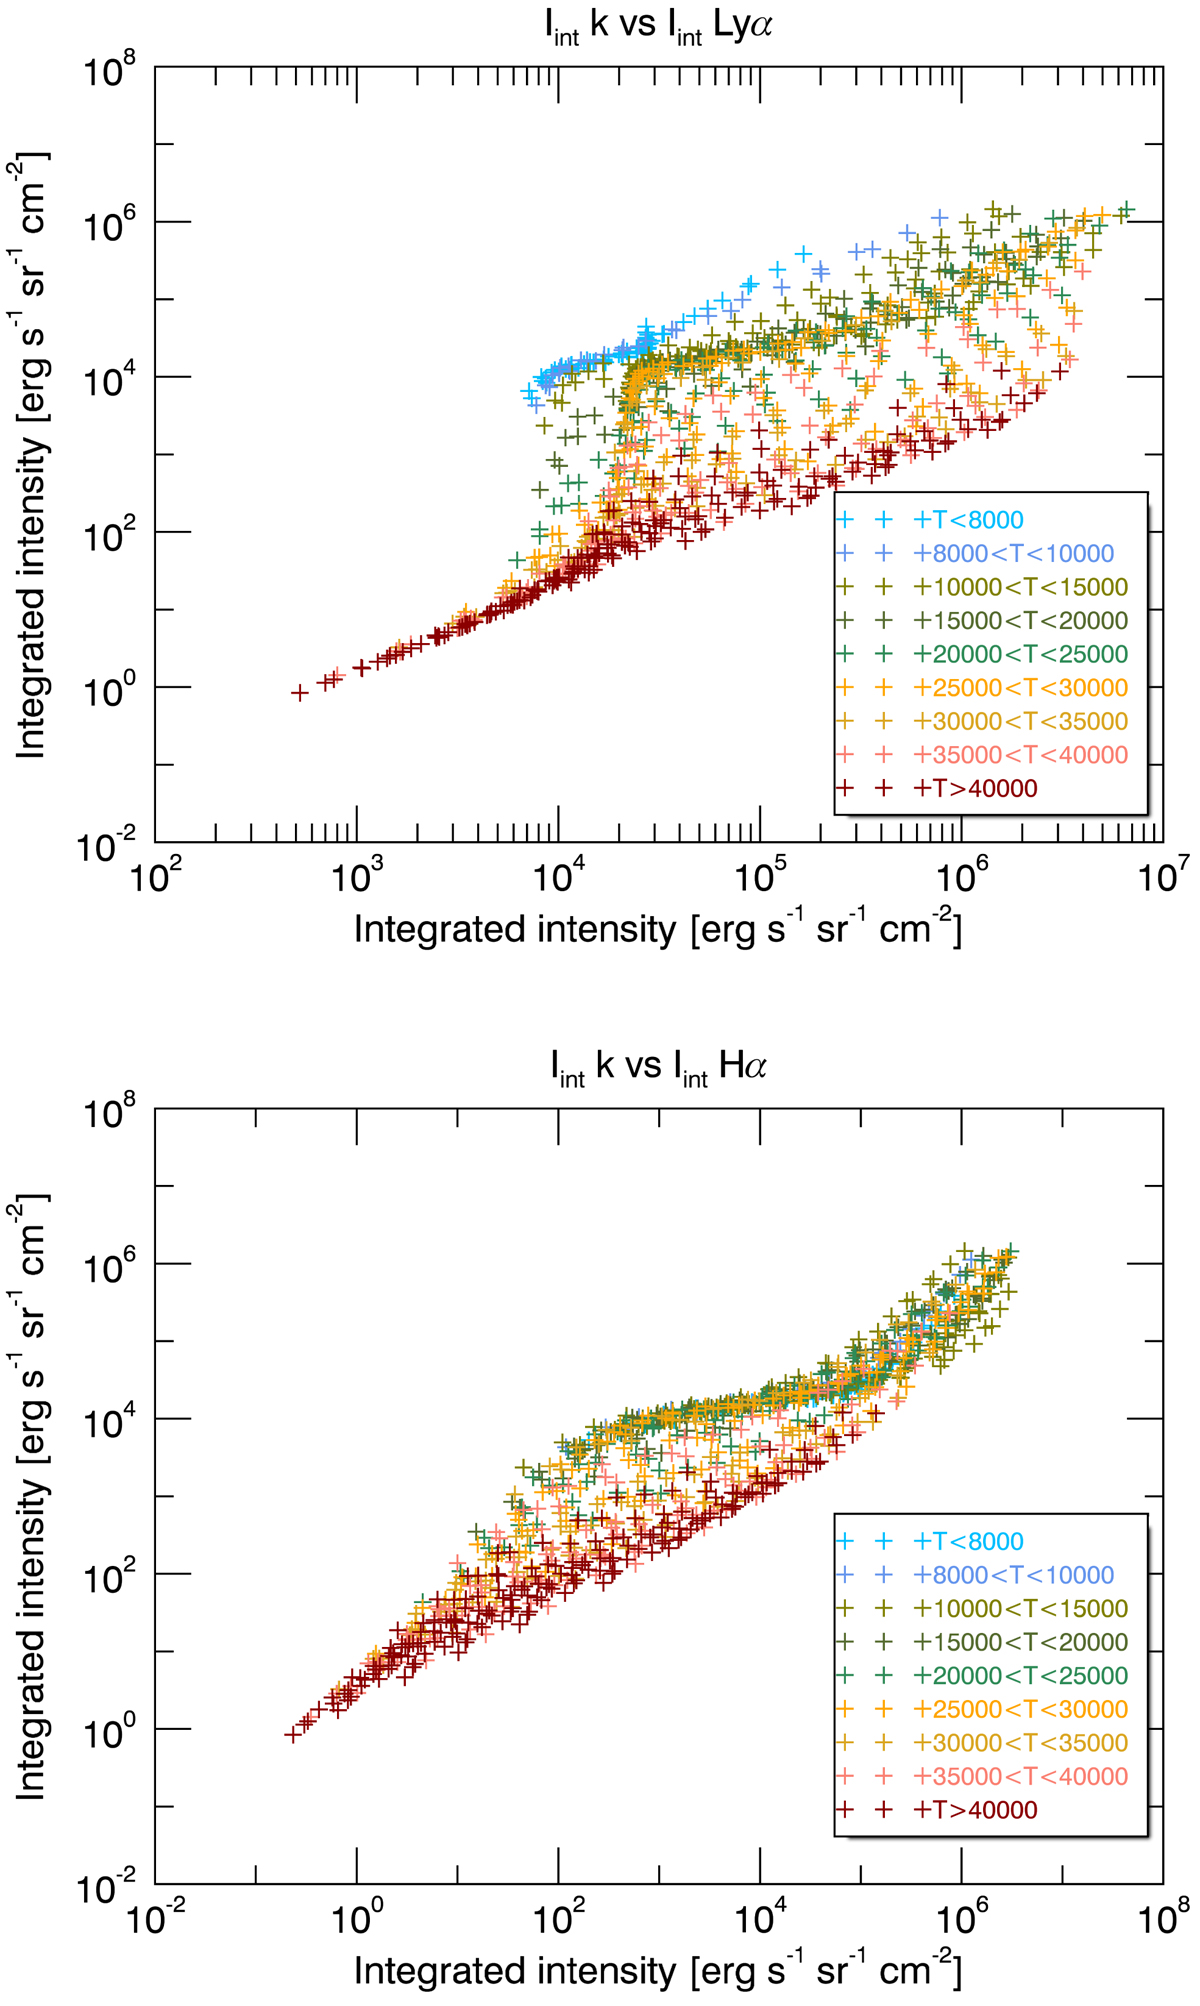
Frequency-integrated intensity in the k line as a function of the Lyα (top) and Hα (bottom) frequency-integrated intensities. The results are plotted for isothermal and for isobaric models, and for models with a PCTR. Each colour corresponds to a given range of mean temperatures.
Current usage metrics show cumulative count of Article Views (full-text article views including HTML views, PDF and ePub downloads, according to the available data) and Abstracts Views on Vision4Press platform.
Data correspond to usage on the plateform after 2015. The current usage metrics is available 48-96 hours after online publication and is updated daily on week days.
Initial download of the metrics may take a while.