Fig. 10.
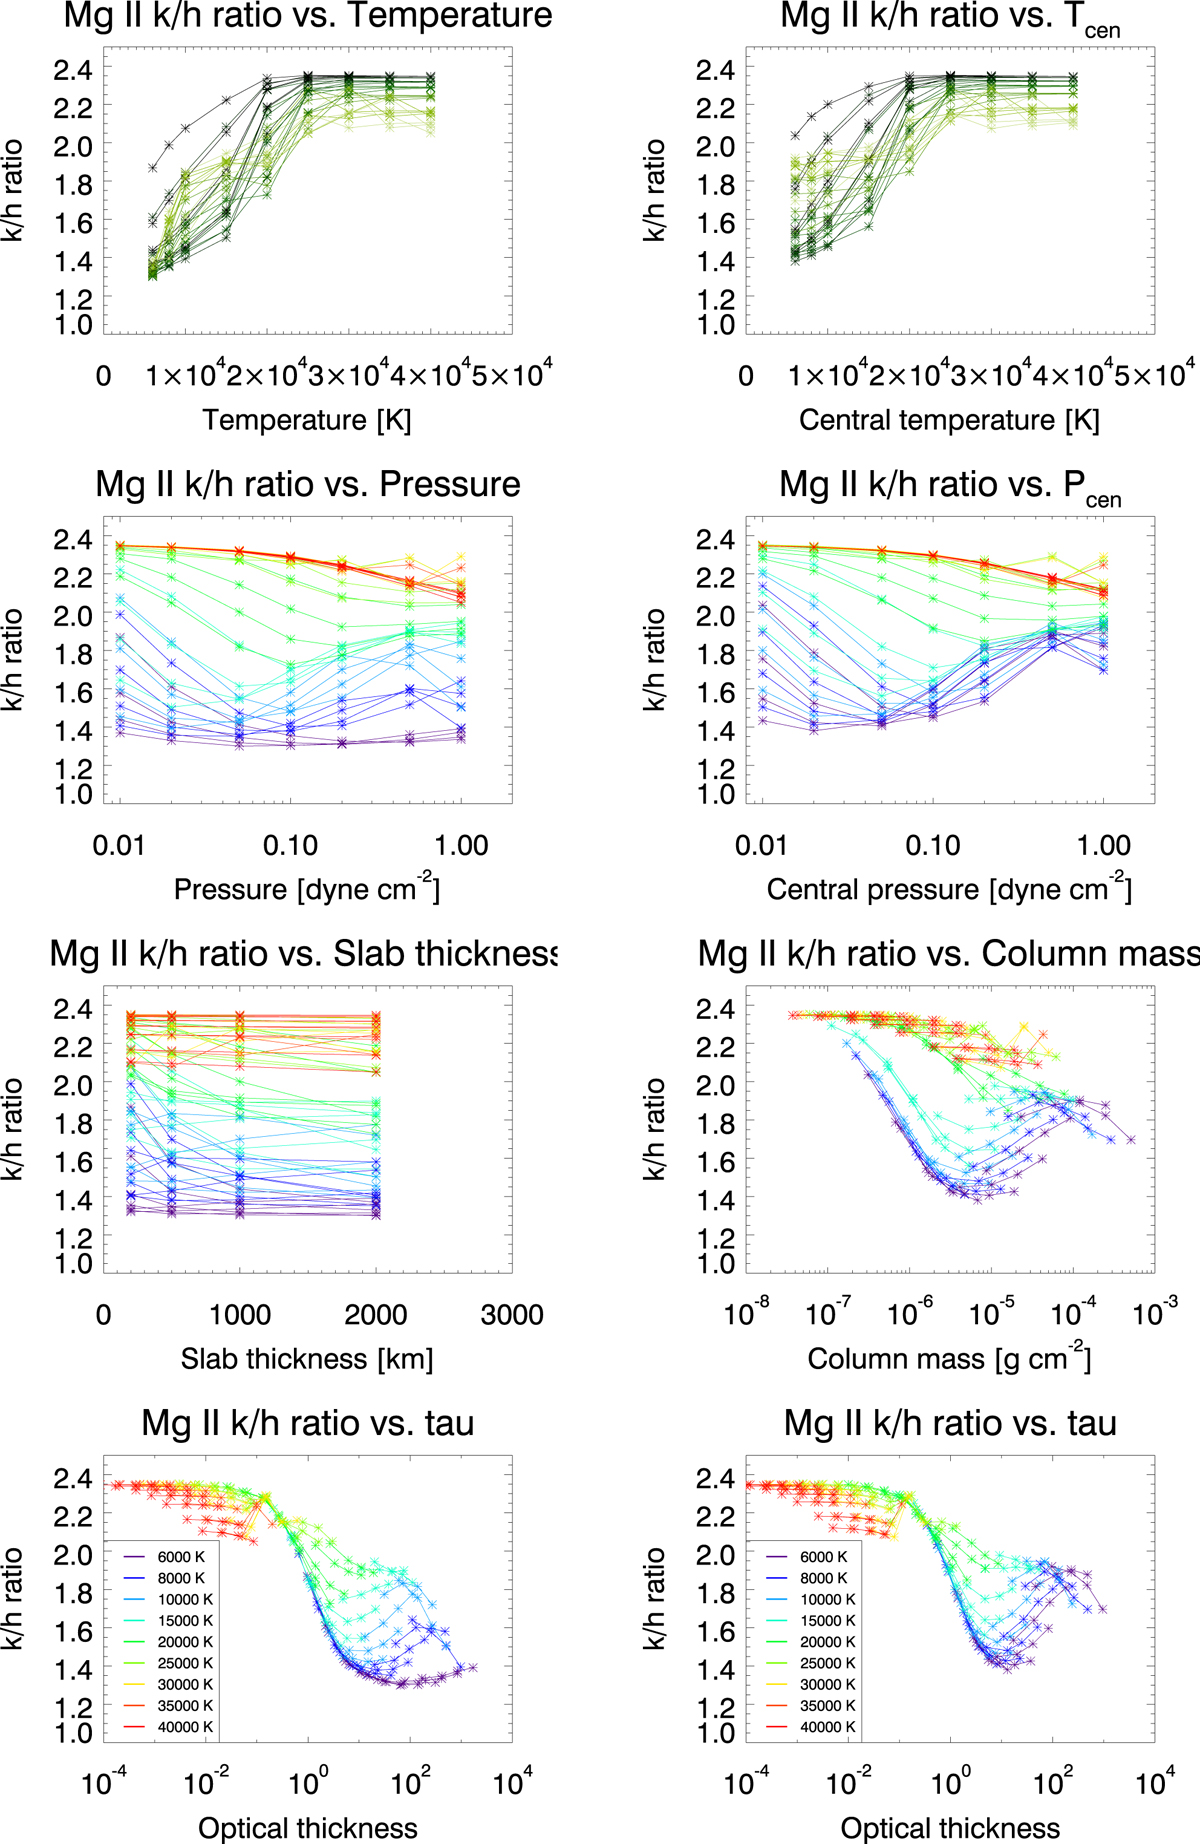
Mg II k/h line ratio against physical parameters for the isothermal isobaric (left column) and PCTR (with γ = 2, right column) models. First row: k/h line ratio vs. T (left) or Tcen (right), colour scale indicates pressure. Second row: k/h line ratio vs. P (left) or Pcen (right), colour scale indicates temperature. Third row: k/h line ratio vs. D (left) or M (right), colour scale indicates temperature. Bottom row: k/h line ratio vs. τh, colour scale indicates temperature.
Current usage metrics show cumulative count of Article Views (full-text article views including HTML views, PDF and ePub downloads, according to the available data) and Abstracts Views on Vision4Press platform.
Data correspond to usage on the plateform after 2015. The current usage metrics is available 48-96 hours after online publication and is updated daily on week days.
Initial download of the metrics may take a while.