Free Access
Fig. 1.
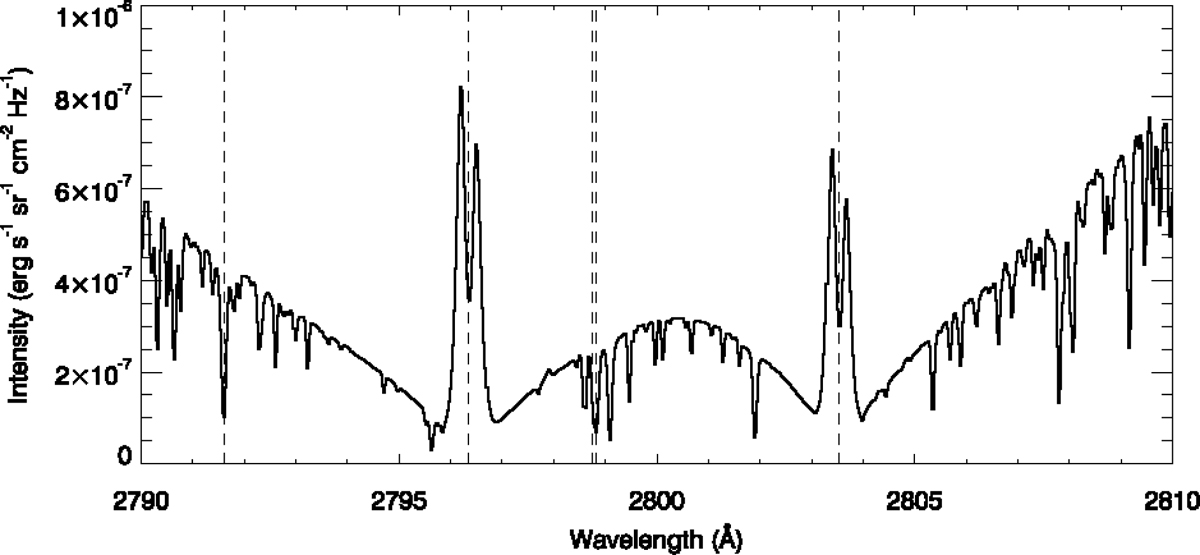
Averaged Sun-centre spectrum from 29 September 2013, used in the calculation of incident profiles in the Mg II updates to the PROM code. Dashed lines indicate locations of the five Mg II lines of interest. From left to right: 2791.60 Å, 2796.35 Å (k), 2798.75 Å, 2798.82 Å, and 2803.53 Å (h).
Current usage metrics show cumulative count of Article Views (full-text article views including HTML views, PDF and ePub downloads, according to the available data) and Abstracts Views on Vision4Press platform.
Data correspond to usage on the plateform after 2015. The current usage metrics is available 48-96 hours after online publication and is updated daily on week days.
Initial download of the metrics may take a while.