Fig. 2.
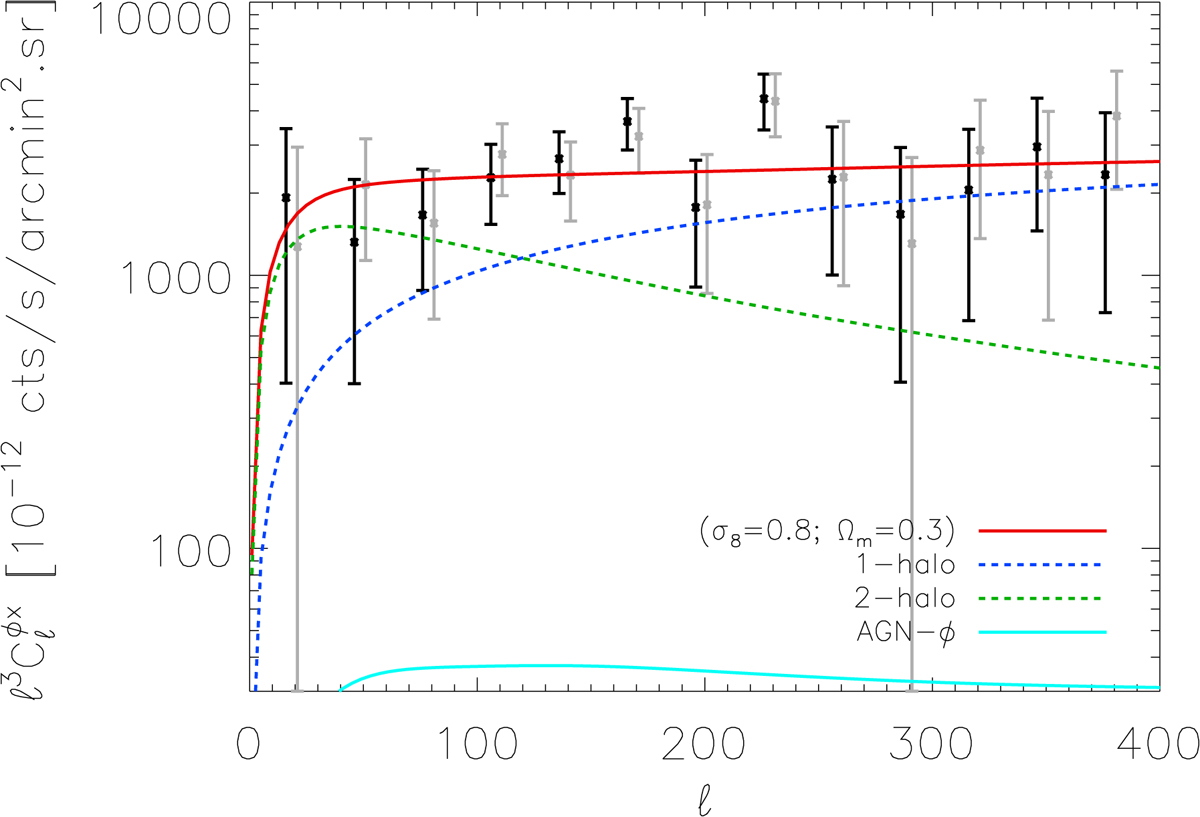
X-ray–ϕ cross-correlation angular power spectrum, measured between Planck CMB lensing full-sky map and a RASS data reprojected on the full-sky (black sample); the same cross-spectra when masking NVSS sources is shown as grey samples. The red solid line shows the theoretical prediction assuming (σ8 = 0.8, Ωm = 0.3, bH = 0.2), the green dashed line shows the two-halo term contribution, and the blue dashed line the one-halo term contribution. The solid cyan line displays the contribution from AGN–ϕ cross-correlation.
Current usage metrics show cumulative count of Article Views (full-text article views including HTML views, PDF and ePub downloads, according to the available data) and Abstracts Views on Vision4Press platform.
Data correspond to usage on the plateform after 2015. The current usage metrics is available 48-96 hours after online publication and is updated daily on week days.
Initial download of the metrics may take a while.