| Issue |
A&A
Volume 625, May 2019
|
|
|---|---|---|
| Article Number | C3 | |
| Number of page(s) | 1 | |
| Section | Stellar structure and evolution | |
| DOI | https://doi.org/10.1051/0004-6361/201731832e | |
| Published online | 29 May 2019 | |
Hertzsprung-Russell diagram and mass distribution of barium stars (Corrigendum)
1
Institute of Astronomy, KU Leuven, Celestijnenlaan 200D, 3001 Leuven, Belgium
e-mail: ana.escorza@ster.kuleuven.be
2
Institut d’Astronomie et d’Astrophysique, Université Libre de Bruxelles, ULB, Campus Plaine C.P. 226, Boulevard du Triomphe, 1050 Bruxelles, Belgium
3
ESO, Karl Schwarzschild Straße 2, 85748 Garching bei München, Germany
Key words: binaries: general / stars: late-type / stars: chemically peculiar / errata, addenda
We noticed that the values of PRGB, 1 and to a lower extent PAGB, 1 shown in Fig. 17 of our article Escorza et al. (2017) had been wrongly estimated because the algorithm to find the maximum stellar radius contained an error. In the original plot, we did not discard the core-He burning phase and for stars with M ≳ 2.2 M⊙, the radius during core-He burning can exceed the value at the RGB tip. A correct version of Fig. 17 is published on this page.
The main difference between the two figures concerns the critical periods at which the primary star fills its Roche lobe at the tip of the RGB. Intermediate-mass stars (2.4 ≲ M/M⊙ ≲ 8) do not expand a lot during their RGB evolution. They are thus less likely to fill their Roche lobe (their critical period remains short) and do not disappear from the barium star population. The bump between 2 and 3 M⊙ shown in the old version of the figure is removed with the new data, comforting this conclusion. Systems with a low-mass (M < 2.4 M⊙) primary and periods shorter than 110 d suffer from Roche-lobe overflow (RLOF) at the RGB tip. For these stars, the critical period increases with decreasing mass up to about 1000 d for 1 M⊙ stars.
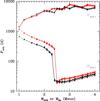 |
Fig. 17. Critical periods below which one of the components fills its Roche lobe at either the tip of the RGB (PRGB, 1, dashed line at the bottom of the figure) or at the tip of the AGB (PAGB, 1, solid line at the top of the figure). The values RRGB, tip and RAGB, tip are computed from the STAREVOL outputs. Red curves have solar metallicity Z = 0.0134 and black curves have [Fe/H]= − 0.5 or Z = 0.0043. Various superimposed lines in a series correspond to various barium-star masses, MBa, which may be identified from the starting point of the curve. The critical period PRGB, 2 can be read off the PRGB, 1 curve at the corresponding MBa value, which determines the key value RRGB, tip. Although PRGB, 1 and PRGB, 2 are not strictly equal, they are not different enough to warrant a specific PRGB, 2 curve that would jeopardize the clarity of the figure. |
References
- Escorza, A., Boffin, H. M. J., Jorissen, A., et al. 2017, A&A, 608, A100 [NASA ADS] [CrossRef] [EDP Sciences] [Google Scholar]
© ESO 2019
All Figures
|
Fig. 17. Critical periods below which one of the components fills its Roche lobe at either the tip of the RGB (PRGB, 1, dashed line at the bottom of the figure) or at the tip of the AGB (PAGB, 1, solid line at the top of the figure). The values RRGB, tip and RAGB, tip are computed from the STAREVOL outputs. Red curves have solar metallicity Z = 0.0134 and black curves have [Fe/H]= − 0.5 or Z = 0.0043. Various superimposed lines in a series correspond to various barium-star masses, MBa, which may be identified from the starting point of the curve. The critical period PRGB, 2 can be read off the PRGB, 1 curve at the corresponding MBa value, which determines the key value RRGB, tip. Although PRGB, 1 and PRGB, 2 are not strictly equal, they are not different enough to warrant a specific PRGB, 2 curve that would jeopardize the clarity of the figure. |
| In the text | |
Current usage metrics show cumulative count of Article Views (full-text article views including HTML views, PDF and ePub downloads, according to the available data) and Abstracts Views on Vision4Press platform.
Data correspond to usage on the plateform after 2015. The current usage metrics is available 48-96 hours after online publication and is updated daily on week days.
Initial download of the metrics may take a while.