| Issue |
A&A
Volume 624, April 2019
|
|
|---|---|---|
| Article Number | L14 | |
| Number of page(s) | 11 | |
| Section | Letters to the Editor | |
| DOI | https://doi.org/10.1051/0004-6361/201935526 | |
| Published online | 26 April 2019 | |
Letter to the Editor
Dust properties of double-tailed active asteroid (6478) Gault
1
Instituto de Astrofísica de Andalucía, CSIC, Glorieta de la Astronomía s/n, 18008 Granada, Spain
e-mail: This email address is being protected from spambots. You need JavaScript enabled to view it.
2
Space sciences, Technologies & Astrophysics Research (STAR) Institute, Université de Liège, 4000 Liège, Belgium
3
Instituto de Astrofísica de Canarias, Vía Láctea s/n, 38205 La Laguna, Spain
4
Departamento de Astrofísica, Universidad de La Laguna, 38206 La Laguna, Tenerife, Spain
5
EXOTIC Lab, UR Astrobiology, AGO Department, University of Liège, 4000 Liège, Belgium
6
Oukaimeden Observatory, High Energy Physics and Astrophysics Laboratory, Cadi Ayyad University, Marrakech, Morocco
7
Lowell Observatory, 1400 West Mars Hill Road, Flagstaff, AZ 86001, USA
8
ESO (European Southern Observatory), Alonso de Cordova 3107, Vitacura, Santiago, Chile
9
GRANTECAN, Cuesta de San José s/n, 38712 Breña Baja, La Palma, Spain
Received:
24
March
2019
Accepted:
11
April
2019
Abstract
Context. Asteroid (6478) Gault was discovered to exhibit a comet-like tail in observations from December 2018, becoming a new member of the so-called active asteroid population in the main asteroid belt.
Aims. We seek to investigate the grain properties of the dust ejected from asteroid (6478) Gault and to give insight into the activity mechanism(s).
Methods. We use a Monte Carlo dust tail brightness code to retrieve the dates of dust ejection, the physical properties of the grains, and the total dust mass losses during each event. The code takes into account the brightness contribution of the asteroid itself. The model is applied to a large data set of images spanning the period from 2019 January 11 to 2019 March 13. In addition, we carried out both short- and long-term photometric measurements of the asteroid.
Results. It is shown that, to date, asteroid (6478) Gault has experienced two episodes of impulsive dust ejection, which took place around 2018 November 5 and 2019 January 2. These two episodes released at least 1.4 × 10⁷ kg and 1.6 × 10⁶ kg of dust, respectively, at escape speeds. The size distribution, consisting of particles in the 1 μm–1 cm radius range, follows a broken power law with bending points near 15 μm and 870 μm. On the other hand, the photometric series indicate a nearly constant magnitude over several 5–7.3 h periods, which is a possible effect of the masking of a rotational light curve by the dust.
Conclusions. The dust particles forming Gault’s tails were released from the asteroid at escape speeds, but the specific ejection mechanism is unclear until photometry of the dust-free asteroid are conducted to assess whether this was related to rotational disruption or to other possible causes.
Key words: methods: data analysis / techniques: photometric / minor planets / asteroids: individual: Gault
© ESO 2019
1. Introduction
The main belt asteroid (6478) Gault (hereinafter Gault for short), which is a member of the 25 Phocaea asteroid family1, was reported to have a comet-like tail at PA = 290° on 2018 December 8 from Asteroid Terrestrial-impact Last Alert System (ATLAS) images. An early Finson–Probstein (Finson & Probstein 1968) analysis of those images revealed ejection of material in early November 2018 (Smith et al. 2019). Previous images from ATLAS and Panoramic Survey Telescope and Rapid Response System (PanSTARRS) back to 2010 do not show any sign of activity. Follow-up imaging of the object revealed the presence of another growing tail-like structure at about PA = 305° (Jehin et al. 2019), which is probably associated with a second ejection event.
The orbital elements of Gault are a = 2.305 au, e = 0.194, and i = 22.81°, which makes this asteroid an inner main belt object with a Tisserand parameter with respect to Jupiter of T = 3.46. This classifies Gault as a new member of the active asteroid population (e.g. Jewitt et al. 2015). As with many other active asteroids that show long-term dynamical stability (e.g. Haghighipour 2009; Jewitt et al. 2009), its orbit is stable on timescales of 100 Myr or longer, as we verified by backward dynamical evolution using the Mercury integrator (Chambers 1999) starting from the current orbital elements of Gault. This implies that Gault is a native member of the main belt. Among the possible causes for the activity in these objects, impact, rotational break-up, and ice sublimation (or even a combination of these) are usually invoked (see Jewitt et al. 2015 for a complete description of the possible mechanisms involved). In principle, activity related to ice sublimation on Gault seems unlikely because this object is characterized as an inner belt asteroid. Likewise, the occurrence of two successive impacts seems rather improbable. The appearance of Gault is becoming similar to asteroid 311P (Jewitt et al. 2013; Moreno et al. 2014; Hainaut et al. 2014), currently described as a close binary, in which one of the components rotates near the centripetal limit (Jewitt et al. 2018).
In this paper, we describe observations and models of Gault to impose constraints on the physical properties of the ejected dust and to shed light on the activity timeline and causes for the ejection events.
2. Observations and data reduction
Images of Gault have been obtained at various telescopes around the world in the time frame from 2019 January 11 to February 15. Table 1 shows the log of the observations. Except for the observations from the Southern Astrophysical Research Telescope (SOAR) 4.1 m telescope, in which a broadband V + Rc filter was used, either Sloan r or Rc (Cousins) filters were used. The images from Gran Telescopio Canarias (GTC) 10.4 m telescope were calibrated using standard stars, while in all the other cases, field stars and the USNO-B1.0 catalogue was used in the reduction procedure. Median stacking was performed for the Transiting Planets and Planetesimals Small Telescope (TRAPPIST; Jehin et al. 2011) images to improve the signal-to-noise ratio. The seeing disc varied between 0.8 and 1.5 arcsec full width at half maximum (FWHM). The early images show a single narrow tail near PA = 290° and a dense nuclear condensation (Fig. 1a). Since early February, a second tail started to show up near PA = 305° (Fig. 1b).
Journal of the observations: imaging.
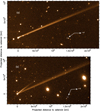 |
Fig. 1. Sample images of asteroid (6478) Gault. Panel a: image obtained on 2019 January 14 with OSIRIS at the 10.4 m Gran Telescopio Canarias through a Sloan r filter. Panel b: image obtained on 2019 February 15 with SOAR 4.1 m telescope through a V + Rc broadband filter. North is up, east to the left. The directions to the Sun and the negative of the heliocentric velocity vector (v) are shown. |
In addition to the images, long photometric series were obtained with both TRAPPIST-North (TN) and -South (TS) on 2019 January 13, 14, and 15 to determine the rotation period of the asteroid. In total we acquired five light curves of about 5 h each, taken with the Rc filter and an exposure time of 120 s (Table 2). On January 14 and 15, we observed first with TN and then with TS, all with the Rc filter, which allowed continuous observation during 7.3 h, with some overlap between the two telescopes. The calibration of the images was made with Image Reduction and Analysis Facility (IRAF) scripts using corresponding flat fields, bias, and dark frames. The photometry was derived using the PhotometryPipeline (Mommert 2017). About 700–900 stars in the PanSTARRS catalogue were used for the photometric calibration to obtain the apparent Rc magnitudes.
Summary of Gault short-term photometric series (RC filter).
3. Dust tail brightness code
In the simulations of the tails brightnesses we used our Monte Carlo dust tail code that has already been described in several works in the past to characterise the dust environments of comets and main-belt comets (see e.g. Moreno et al. 2016, 2017), therefore we only give a brief description in this work. The dynamics of the particles (assumed spherical) are described by the β parameter, defined as  , where d is the particle diameter; Cpr = 1.19 × 10⁻⁴ g cm−2 is the radiation pressure coefficient; and Qpr is the scattering efficiency for radiation pressure, which is Qpr ≈ 1 for absorbing particles that are large compared to the observation wavelength (Burns et al. 1979).
As Gault is an inner belt asteroid that is likely S-type, the particle density is assumed at ρ = 3400 kg m−3, which is appropriate for S-type asteroid Itokawa regolith (Tsuchiyama et al. 2011). The code computes the position in the sky plane of a large number of particles emitted isotropically from the asteroid, whose trajectories depend on β and their terminal velocities (e.g. Fulle 1989). We assume a broad differential size distribution of particles between 1 μm and 1 cm in radius, following a power-law function.
Prior to this activity period, Gault absolute magnitude was reported as H = 14.4 (JPL Small-Body Database). We assume a geometric albedo of pν = 0.15, which is appropriate for a S-type asteroid (e.g. Luu & Jewitt 1989). Then, its diameter can be calculated as D = 4.5 km, using the equation by Harris & Lagerros (2002). Owing to its significant size, in the simulations we added the asteroid brightness contribution to the tail brightness, assuming a constant cross section with time. To produce realistic model images to be compared with the observations, we performed a convolution of the synthetic images obtained with a two-dimensional Gaussian function. The FWHM of the Gaussian was set to the average seeing value at the corresponding observation date. The asteroid and the brightness of the dust particles were corrected for the effect of the phase angle. For the asteroid we applied a linear phase coefficient of b = 0.033 mag deg−1, which is computed from the relation by Belskaya & Shevchenko (2000). For the dust particles ejected, we assumed the same values of pν and b as for the asteroid.
The remaining model parameters are the event times and duration, dust masses ejected, and terminal particle speeds. The speed is assumed to follow a law of the kind ν = ν0βγ. For a sublimating body in which particles are accelerated by gas drag, γ ∼ 0.5. For a simple model of rotational disruption, a size-independent speed would be expected, so that γ ∼ 0. The event times are preliminarily guessed by a syndyne-synchrone analysis (Finson & Probstein 1968), which applies to zero ejection velocity conditions, and then refined by the Monte Carlo dust tail model. The dust loss rates are assumed to be constant during the occurrence of the ejection events.
The fitting procedure is accomplished by performing a minimisation of the quantity  , where the summation is extended to all the images included in the analysis, and
 ![Mathematical equation: $ \sigma_l=\sqrt{\sum\limits_{i,j} \frac{(\log_{10}[B_{\mathrm{obs}}(i,j)]-\log_{10}[B_{\mathrm{mod}}(i,j)])^2}{N_l}} $](/articles/aa/full_html/2019/04/aa35526-19/aa35526-19-eq3.gif) is the standard deviation of the model brightness (Bmod) with respect to the observed brightness(Bobs) for image l, where (i, j) represent the image pixel location, and Nl the total number of pixels of image l. This minimisation is performed using a multidimensional downhill simplex method (Nelder & Mead 1965).
is the standard deviation of the model brightness (Bmod) with respect to the observed brightness(Bobs) for image l, where (i, j) represent the image pixel location, and Nl the total number of pixels of image l. This minimisation is performed using a multidimensional downhill simplex method (Nelder & Mead 1965).
4. The light curve
The aim of obtaining the light curves was primarily to search for the rotation period of Gault. The apparent Rc magnitudes were converted to absolute magnitudes H by assuming V − Rc = 0.49 (Shevchenko & Lupishko 1998) and a slope parameter G = 0.227 (Warner et al. 2009); both of these values are appropriate for S-type asteroids. The resulting light curves are shown in Fig. 2. Each light curve is essentially flat, except for a weak slope in the first half of the light curve of January 13. All these data did not allow us to determine a rotation period or to observe any trend of the magnitude on several consecutive days. If the rotation period of Gault was an integer divider of 24 h, we would have observed the same part of the rotation each time. However, as we observed three nights continuously for 5 h, 7.3 h, and 7.3 h, respectively, it is very unlikely that we were observing the same flat part of Gault’s light curve each time. The possibilities to explain a flat light curve for an asteroid include a nearly spherical shape, pole-on observation, and the presence of dust around the asteroid hiding its surface. Fast rotators typically present a roughly spheroidal shape, resembling a spinning top. The amplitude of the light curves of these kinds of asteroids is small (i.e. ≲0.2 mag). If the object is embedded in a coma this small variation can easily be masked (Licandro et al. 2000). For Gault, given the magnitude of the inactive asteroid (H = 14.4), we find that approximately half of the total brightness is produced by the dust envelope on the light curve dates. A recent study performed by Kleyna et al. (2019) points to a ∼2 h rotation period for Gault, which would indicate a superfast rotator and probable rotational disruption as the cause of the dust ejection. Further photometric observations when the asteroid has no detectable coma will give additional results on the rotation properties.
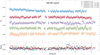 |
Fig. 2. Absolute H magnitude light curves of (6478) Gault obtained with TN and TS on 2019 January 13, 14, and 15. The TS 2019 January 13 data correspond to the true magnitude values on the y-axis, while the other datasets are shifted by multiples of 0.3 mag downwards, as indicated. Errors correspond to 2σ. |
5. Results and discussion
Since the number of free parameters in the model is large, we had to perform preliminary searches of some of the input parameters to make the problem tractable. Thus, the exponent γ in the particle ejection speed equation was set to γ = 0.5. Although this value is appropriate to gas drag acceleration from an ice-sublimating body, we had to assume this value to explain the observed widening of the main tail as a function of distance to the asteroid, mainly for the latest images acquired (see Fig. 1b and Figs. A.8–A.10). At present, we do not find any explanation for this fact, as ice sublimation seems rather improbable. The overall width of the tails depend on ν0. We found a value ν0 = 3 m s−1 as appropriate, which implies terminal speeds values of ∼0.4 m s−1 for 10 μm particles, and lower for larger particles. These terminal speeds are comparable to the escape velocity of the asteroid at distances at which the asteroid gravity becomes negligible compared to solar gravity. Thus, if we assume for the bulk density of the asteroid a value typical for S-type (ρbulk = 2710 kg m−3; Krasinsky et al. 2002), the escape velocity at 100 km from the asteroid surface would be ∼0.4 m s−1, where the ratio of solar gravity to asteroid gravity is larger than 103. This indicates that the particles populating Gault tails were likely released at near escape speeds from the asteroid surface. This would be compatible with a rotational break-up. However, the speed dependence on particle size seems incompatible with this mechanism. A simple model of rotational disruption would yield a size-independent ejection speed.
On the other hand, the event times are preliminarily guessed by a syndyne-synchrone analysis (Finson & Probstein 1968), which applies to zero ejection velocity conditions, and then refined by the Monte Carlo dust tail model. The duration of such events is only weakly constrained by the model, provided they are shorter than ∼five days. We then fixed the duration to one day for simplicity, keeping in mind that this can be in fact much shorter.
After these preliminary searches of the mentioned parameters, we then solved for the total mass of dust ejected and the power-law index of the differential size distribution. It soon became apparent that a single power-law function was inadequate to describe the variation of the brightness of the main tail with distance to the asteroid. It comes from the fact that the brightness along the tail first slightly increases or keeps constant tailwards, and finally decreases (see Fig. 1, and Figs. A.1–A.10). In order to fit properly the observed brightness profile we adopted a broken power law with two bending points. This left us with a total of seven fitting parameters: the two bending points, the three power-law indexes, and the dust mass released during each event. The resulting best-fit differential size distribution was characterised by power-law indexes of –2.28 (between 1 μm and 15 μm), –3.95 (between 15 μm and 870 μm), and –4.22 (between 870 μm and 1 cm). This probably reflects the asteroid regolith size distribution. Broken power-law functions are common when describing the size distributions of asteroid dust bands (Nesvorný et al. 2006), and the boulder distribution in asteroid regoliths (Tancredi et al. 2015) or in cometary dust (Fulle et al. 2016; Moreno et al. 2016), which always have a tendency to increase slope with size.
The total dust mass released were of 1.4 × 10⁷, and 1.6 × 10⁶ kg for the 2018 November 5 and 2019 January 2 events, respectively. We need to emphasise that these masses are lower limits to the actual total dust mass ejected. Thus, should a few large and massive boulders have been ejected, they would not contribute significantly to the brightness, but would contribute to the mass. We underline that the same differential size distribution is assumed for the two ejection events. It is very interesting to note the remarkably similar size distribution, ejected masses, and velocities recently reported by Ye et al. (2019).
The fits to the data are shown in Figs. A.1–A.10. These fits are provided as a synthetic image which best fits the observed image at a given date, an isophote map showing the measured and modelled isophotes near the asteroid location, and the brightness along the tail for both the observation and model. The “bumps” along some of these measured profiles (most evident in Figs. A.4, A.5, A.7, A.9, and A.10) are due to contamination by field stars. The asteroid contribution to the brightness profile near the optocentre is more and more important as time progresses, as the dust is being blown away by radiation pressure. The total mass ejected, 1.56 × 10⁷ kg, is negligible compared to the asteroid mass (1.3 × 10¹⁴ kg) and would correspond to a spherical volume of just ∼10 m radius.
6. Conclusions
We have carried out observations and models to characterise the dust properties and event timelines of the double-tailed active asteroid Gault. We have found that this object has experienced two short-lived activity periods of a maximum duration of five days, but might be much shorter, separated by a period of inactivity of nearly two months. A similar activity pattern has been previously observed for inner belt asteroid 311P.
The total dust masses ejected for particles in the 1 μm–1 cm radius were 1.4 × 10⁷, and 1.6 × 10⁶ kg, for the 2018 November 5 and 2019 January 2 events, respectively. These masses represent a negligible fraction of the asteroid mass, estimated at 1.3 × 10¹⁴ kg. To fit the brightness distribution along the main tail, the differential size distribution function can be described as a broken power-law function that has power indexes of –2.28, –3.95, and –4.22, and bending points near 15 μm and 870 μm.
The ejection speeds are found to be close to the escape speed of Gault; this fact is compatible with rotational disruption phenomena. However, the model results point to a β0.5 dependence of the speeds, typical of sublimation-driven processes. This mechanism is, however, very unlikely owing to the inner belt character of the object. Only a detailed light curve of the naked, dust-free asteroid, in combination with dynamical modelling, might shed additional light on the ejection mechanism.
Small Bodies Data Ferret, NASA Planetary Data System, https://sbnapps.psi.edu/olaf/.
Acknowledgments
We would like to thank the reviewer for his/her constructive comments which helped to substantially improve the quality of the paper. F. Moreno acknowledges financial support from the State Agency for Research of the Spanish MCIU through the “Center of Excellence Severo Ochoa” award for the Instituto de Astrofísica de Andalucía (SEV-2017-0709). This article is partially based on observations made with the Gran Telescopio Canarias, installed in the Spanish Observatorio del Roque de los Muchachos of the Instituto de Astrofísica de Canarias (IAC), in the island of La Palma and on observations made in the Observatorios de Canarias del IAC with the MUSCAT2 instrument on the Carlos Sánchez telescope operated on the island of Tenerife by the IAC in the Observatorio del Teide. TRAPPIST-North is a project funded by the University of Liège, in collaboration with Cadi Ayyad University of Marrakech (Morocco). TRAPPIST-South is a project funded by the Belgian Fonds (National) de la Recherche Scientifique (F.R.S.-FNRS) under grant FRFC 2.5.594.09.F. E.J and M.G are F.R.S.-FNRS Senior Research Associates. This work is also based on observations obtained at the Southern Astrophysical Research (SOAR) telescope, which is a joint project of the Ministério da Ciência, Tecnologia, e Inovação (MCTI) da República Federativa do Brasil, the U.S. National Optical Astronomy Observatory (NOAO), the University of North Carolina at Chapel Hill (UNC), and Michigan State University (MSU). This work was supported by contracts AYA2015-67152-R and AYA 2015-71975-REDT from the Spanish Ministerio de Economía y Competitividad (MINECO). J. Licandro gratefully acknowledges support from contract AYA2015-67772-R (MINECO, Spain).
References
- Belskaya, I. N., & Shevchenko, V. G. 2000, Icarus, 147, 94 [NASA ADS] [CrossRef] [Google Scholar]
- Burns, J. A., Lamy, P. L., & Soter, S. 1979, Icarus, 40, 1 [NASA ADS] [CrossRef] [Google Scholar]
- Chambers, J. E. 1999, MNRAS, 304, 793 [NASA ADS] [CrossRef] [MathSciNet] [Google Scholar]
- Finson, M. L., & Probstein, R. F. 1968, ApJ, 154, 353 [NASA ADS] [CrossRef] [Google Scholar]
- Fulle, M. 1989, A&A, 217, 283 [NASA ADS] [Google Scholar]
- Fulle, M., Marzari, F., Della Corte, V., et al. 2016, ApJ, 821, 19 [NASA ADS] [CrossRef] [Google Scholar]
- Haghighipour, N. 2009, Meteor. Planet. Sci., 44, 1863 [NASA ADS] [CrossRef] [Google Scholar]
- Hainaut, O. R., Boehnhardt, H., Snodgrass, C., et al. 2014, A&A, 563, A75 [NASA ADS] [CrossRef] [EDP Sciences] [Google Scholar]
- Harris, A. W., & Lagerros, J. S. V. 2002, Asteroids III (Tucson: Univ. of Arizona Press) [Google Scholar]
- Jehin, E., Gillon, M., Queloz, D., et al. 2011, The Messenger, 145 [Google Scholar]
- Jehin, E., Ferrais, M., Moulane, Y., et al. 2019, Cent. Bureau Electron. Telegrams, 4606 [Google Scholar]
- Jewitt, D., Yang, B., & Haghighipour, N. 2009, AJ, 137, 4313 [NASA ADS] [CrossRef] [Google Scholar]
- Jewitt, D., Agarwal, J., Weaver, H., et al. 2013, ApJ, 778, L21 [NASA ADS] [CrossRef] [Google Scholar]
- Jewitt, D., Hsieh, H., & Agarwal, J. 2015, Asteroids IV (Tucson: Univ. of Arizona Press) [Google Scholar]
- Jewitt, D., Weaver, H., & Mutchler, M. 2018, AJ, 155, 231 [NASA ADS] [CrossRef] [Google Scholar]
- Kleyna, J. T., Hainaut, O. R., Meech, K. J., et al. 2019, ApJ, 874, L20 [NASA ADS] [CrossRef] [Google Scholar]
- Krasinsky, G. A., Pitjeva, E. V., Vasilyev, M. V., et al. 2002, Icarus, 158, 98 [CrossRef] [Google Scholar]
- Licandro, J., Serra-Ricart, M., Oscoz, A., et al. 2000, AJ, 119, 3133 [NASA ADS] [CrossRef] [Google Scholar]
- Luu, J., & Jewitt, D. 1989, AJ, 98, 1905 [NASA ADS] [CrossRef] [Google Scholar]
- Mommert, M. 2017, Astron. Comput., 18, 47 [NASA ADS] [CrossRef] [Google Scholar]
- Moreno, F., Licandro, J., Álvarez-Iglesias, C., et al. 2014, ApJ, 781, 118 [NASA ADS] [CrossRef] [Google Scholar]
- Moreno, F., Snodgrass, C., Hainaut, O., et al. 2016, A&A, 587, 155 [Google Scholar]
- Moreno, F., Pozuelos, F. J., Novaković, B., et al. 2017, ApJ, 837, L3 [Google Scholar]
- Nelder, J. A., & Mead, R. 1965, Comput. J., 7, 308 [Google Scholar]
- Nesvorný, D., Vokrouhlický, D., Bottke, W. F., et al. 2006, Icarus, 181, 107 [NASA ADS] [CrossRef] [Google Scholar]
- Smith, K. W., Denneau, L., Vincent, J. B., et al. 2019, Cent. Bureau Electron. Telegrams, 4594 [Google Scholar]
- Shevchenko, V. G., & Lupishko, D. F. 1998, Sol. Syst. Res., 32, 220 [NASA ADS] [Google Scholar]
- Tancredi, G., Roland, S., & Bruzzone, S. 2015, Icarus, 247, 279 [NASA ADS] [CrossRef] [Google Scholar]
- Tsuchiyama, A., Uesugi, M., Matsushima, T., et al. 2011, Science, 333, 1125 [NASA ADS] [CrossRef] [Google Scholar]
- Warner, B. D., Harris, A. W., & Pravec, P. 2009, Icarus, 202, 134 [NASA ADS] [CrossRef] [Google Scholar]
- Ye, Q., Kelley, M., Bodewits, D., et al. 2019, ApJ, 874, L16 [NASA ADS] [CrossRef] [Google Scholar]
Appendix A: Monte Carlo dust tail model fits to the images
In this Appendix we show the model fits for all the images shown in Table 1.
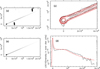 |
Fig. A.1. Results of the model fit for the image obtained with TCS on 2019 January 11. Panel a: observed image. Panel b: model image, using the same brightness scale as in panel a. Panel c: isophote field near the asteroid location (observation in black contours and model in red contours). Panel d: comparison between the observed intensity along the main tail (black line) and the model (red line). Axes are labelled in kilometres projected on the sky at the asteroid distance. In panels a–c, north is up, east to the left. |
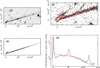 |
Fig. A.10. As Fig. A.1, but for the TRAPPIST image on 2019 March 13. |
All Tables
All Figures
|
Fig. 1. Sample images of asteroid (6478) Gault. Panel a: image obtained on 2019 January 14 with OSIRIS at the 10.4 m Gran Telescopio Canarias through a Sloan r filter. Panel b: image obtained on 2019 February 15 with SOAR 4.1 m telescope through a V + Rc broadband filter. North is up, east to the left. The directions to the Sun and the negative of the heliocentric velocity vector (v) are shown. |
| In the text | |
|
Fig. 2. Absolute H magnitude light curves of (6478) Gault obtained with TN and TS on 2019 January 13, 14, and 15. The TS 2019 January 13 data correspond to the true magnitude values on the y-axis, while the other datasets are shifted by multiples of 0.3 mag downwards, as indicated. Errors correspond to 2σ. |
| In the text | |
|
Fig. A.1. Results of the model fit for the image obtained with TCS on 2019 January 11. Panel a: observed image. Panel b: model image, using the same brightness scale as in panel a. Panel c: isophote field near the asteroid location (observation in black contours and model in red contours). Panel d: comparison between the observed intensity along the main tail (black line) and the model (red line). Axes are labelled in kilometres projected on the sky at the asteroid distance. In panels a–c, north is up, east to the left. |
| In the text | |
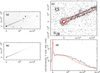 |
Fig. A.2. As Fig. A.1, but for the GTC image on 2019 January 13. |
| In the text | |
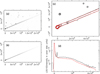 |
Fig. A.3. As Fig. A.1, but for the GTC image on 2019 January 14. |
| In the text | |
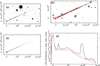 |
Fig. A.4. As Fig. A.1, but for the TRAPPIST image on 2019 January 21. |
| In the text | |
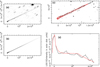 |
Fig. A.5. As Fig. A.1, but for the TRAPPIST image on 2019 January 29. |
| In the text | |
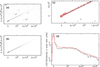 |
Fig. A.6. As Fig. A.1, but for the TRAPPIST image on 2019 February 5. |
| In the text | |
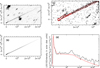 |
Fig. A.7. As Fig. A.1, but for the TRAPPIST image on 2019 February 7. |
| In the text | |
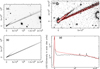 |
Fig. A.8. As Fig. A.1, but for the SOAR image on 2019 February 15. |
| In the text | |
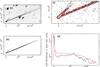 |
Fig. A.9. As Fig. A.1, but for the TRAPPIST image on 2019 March 5. |
| In the text | |
|
Fig. A.10. As Fig. A.1, but for the TRAPPIST image on 2019 March 13. |
| In the text | |
Current usage metrics show cumulative count of Article Views (full-text article views including HTML views, PDF and ePub downloads, according to the available data) and Abstracts Views on Vision4Press platform.
Data correspond to usage on the plateform after 2015. The current usage metrics is available 48-96 hours after online publication and is updated daily on week days.
Initial download of the metrics may take a while.