Fig. A.1.
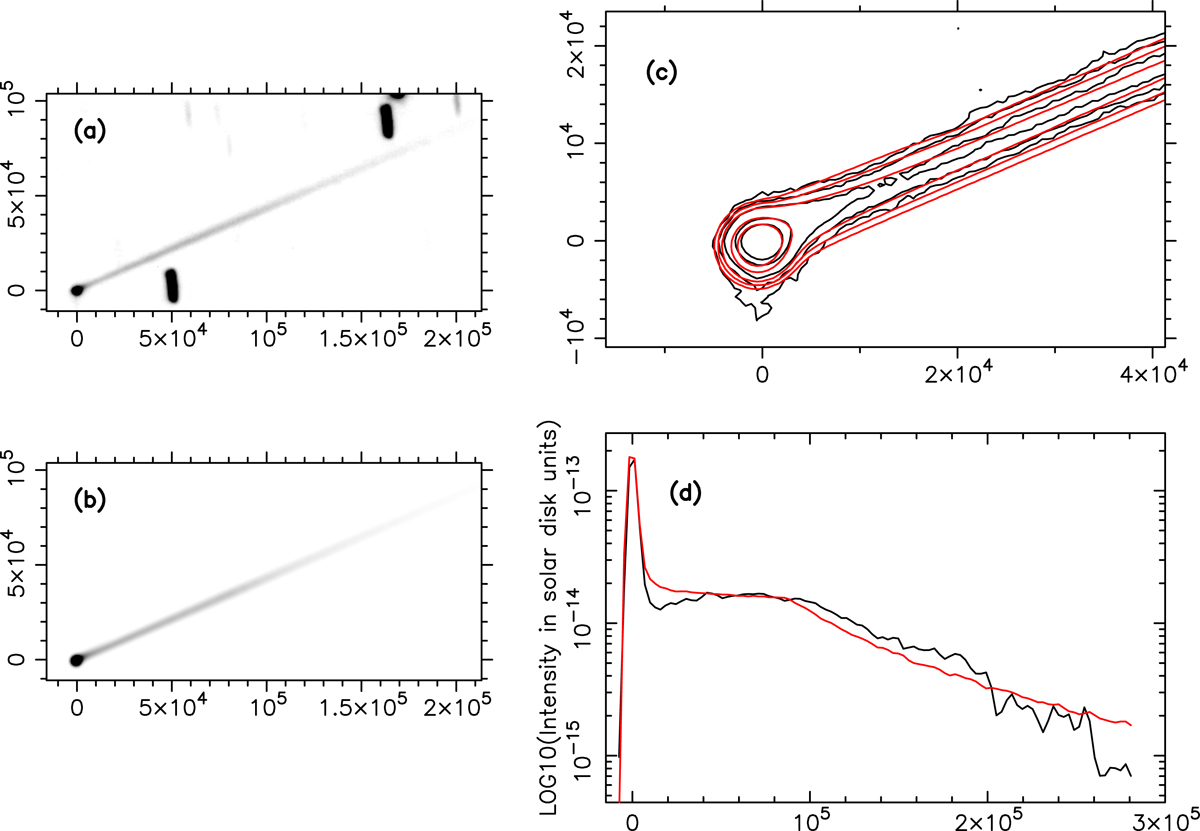
Results of the model fit for the image obtained with TCS on 2019 January 11. Panel a: observed image. Panel b: model image, using the same brightness scale as in panel a. Panel c: isophote field near the asteroid location (observation in black contours and model in red contours). Panel d: comparison between the observed intensity along the main tail (black line) and the model (red line). Axes are labelled in kilometres projected on the sky at the asteroid distance. In panels a–c, north is up, east to the left.
Current usage metrics show cumulative count of Article Views (full-text article views including HTML views, PDF and ePub downloads, according to the available data) and Abstracts Views on Vision4Press platform.
Data correspond to usage on the plateform after 2015. The current usage metrics is available 48-96 hours after online publication and is updated daily on week days.
Initial download of the metrics may take a while.