Fig. 1.
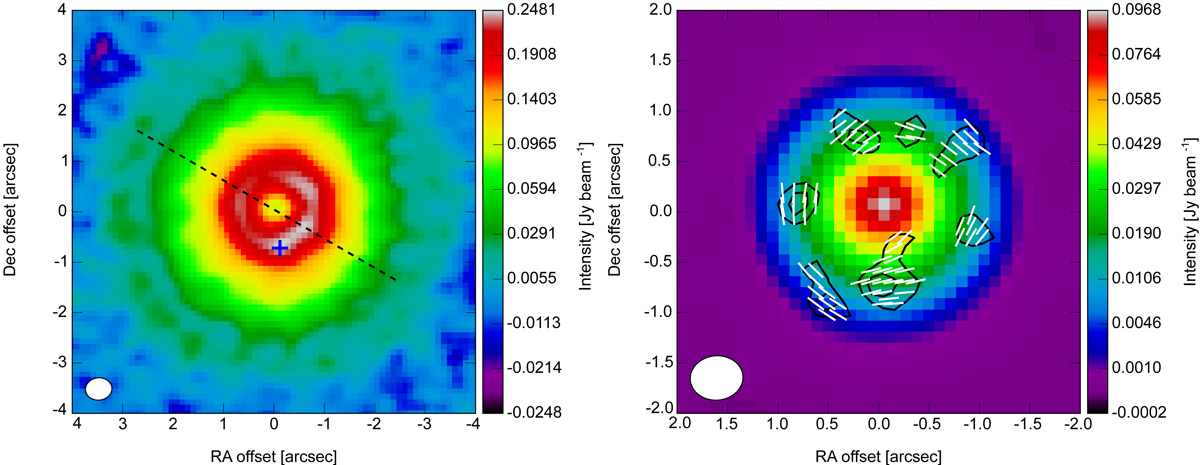
Left panel: integrated intensity map of the CN (N = 2−1, J = 3/2−1/2, F = 5/2−3/2) hyperfine transition around TW Hya. We also indicate the line of nodes of the disc at a position angle of 240° and the location of the strongest CN emission peak that was used in the polarisation analysis (see text). Right panel: continuum and polarised 226 GHz emission of the TW Hya disc. The colour scale is the total intensity dust emission. The contours, drawn at 3 and 4σ, are the linear polarisation, and the white-line segments indicate the electric vector polarisation angle.
Current usage metrics show cumulative count of Article Views (full-text article views including HTML views, PDF and ePub downloads, according to the available data) and Abstracts Views on Vision4Press platform.
Data correspond to usage on the plateform after 2015. The current usage metrics is available 48-96 hours after online publication and is updated daily on week days.
Initial download of the metrics may take a while.