Fig. 5.
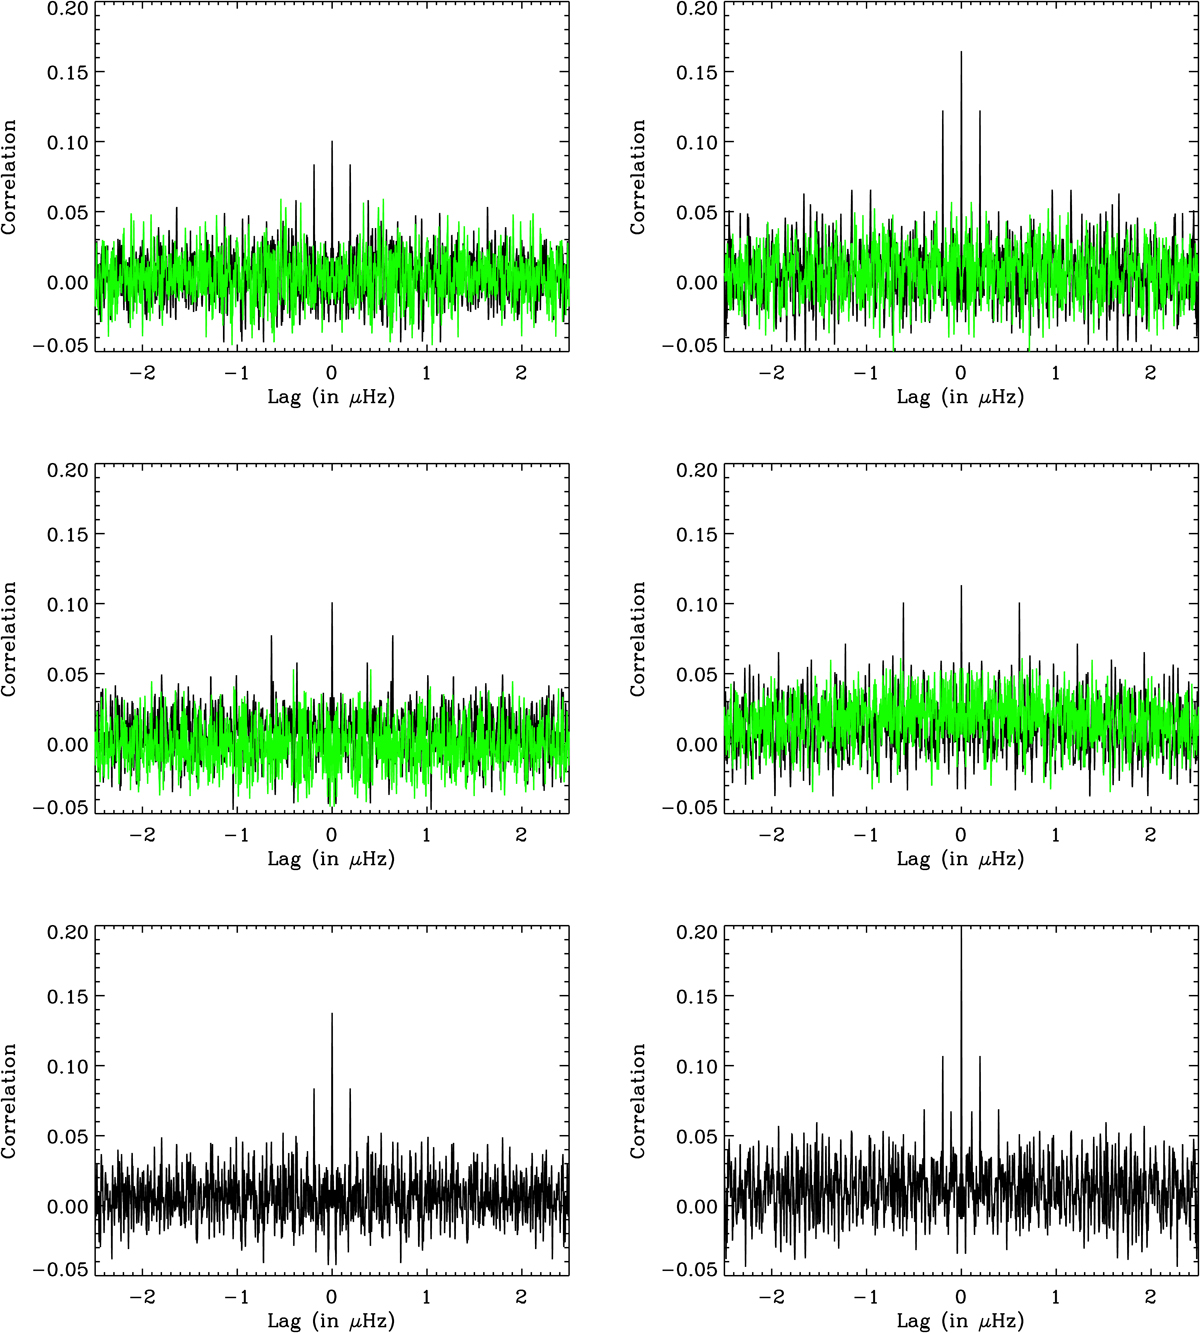
Correlation of the g-mode model spectrum with the power spectrum of a simulated time series of round-trip travel time. Top panel: for l = 1 only (similar to Fig. 1 in FS18). The black line is for the result after optimisation while the green it is before optimisation; middle panel: for l = 2 only. The black line is for the result after optimisation while the green it is before optimisation; bottom panel: for l = 1 and l = 2 (similar to Fig. 2 in FS18). Left panel: for the median value of the sum of the correlations at lag=0 and lag=ν1 obtained over the 2000+ simulations. Right panel: for the maximum value of the sum of the correlations at lag=0 and lag=ν1 obtained over the 2000+ simulations.
Current usage metrics show cumulative count of Article Views (full-text article views including HTML views, PDF and ePub downloads, according to the available data) and Abstracts Views on Vision4Press platform.
Data correspond to usage on the plateform after 2015. The current usage metrics is available 48-96 hours after online publication and is updated daily on week days.
Initial download of the metrics may take a while.