Fig. 3.
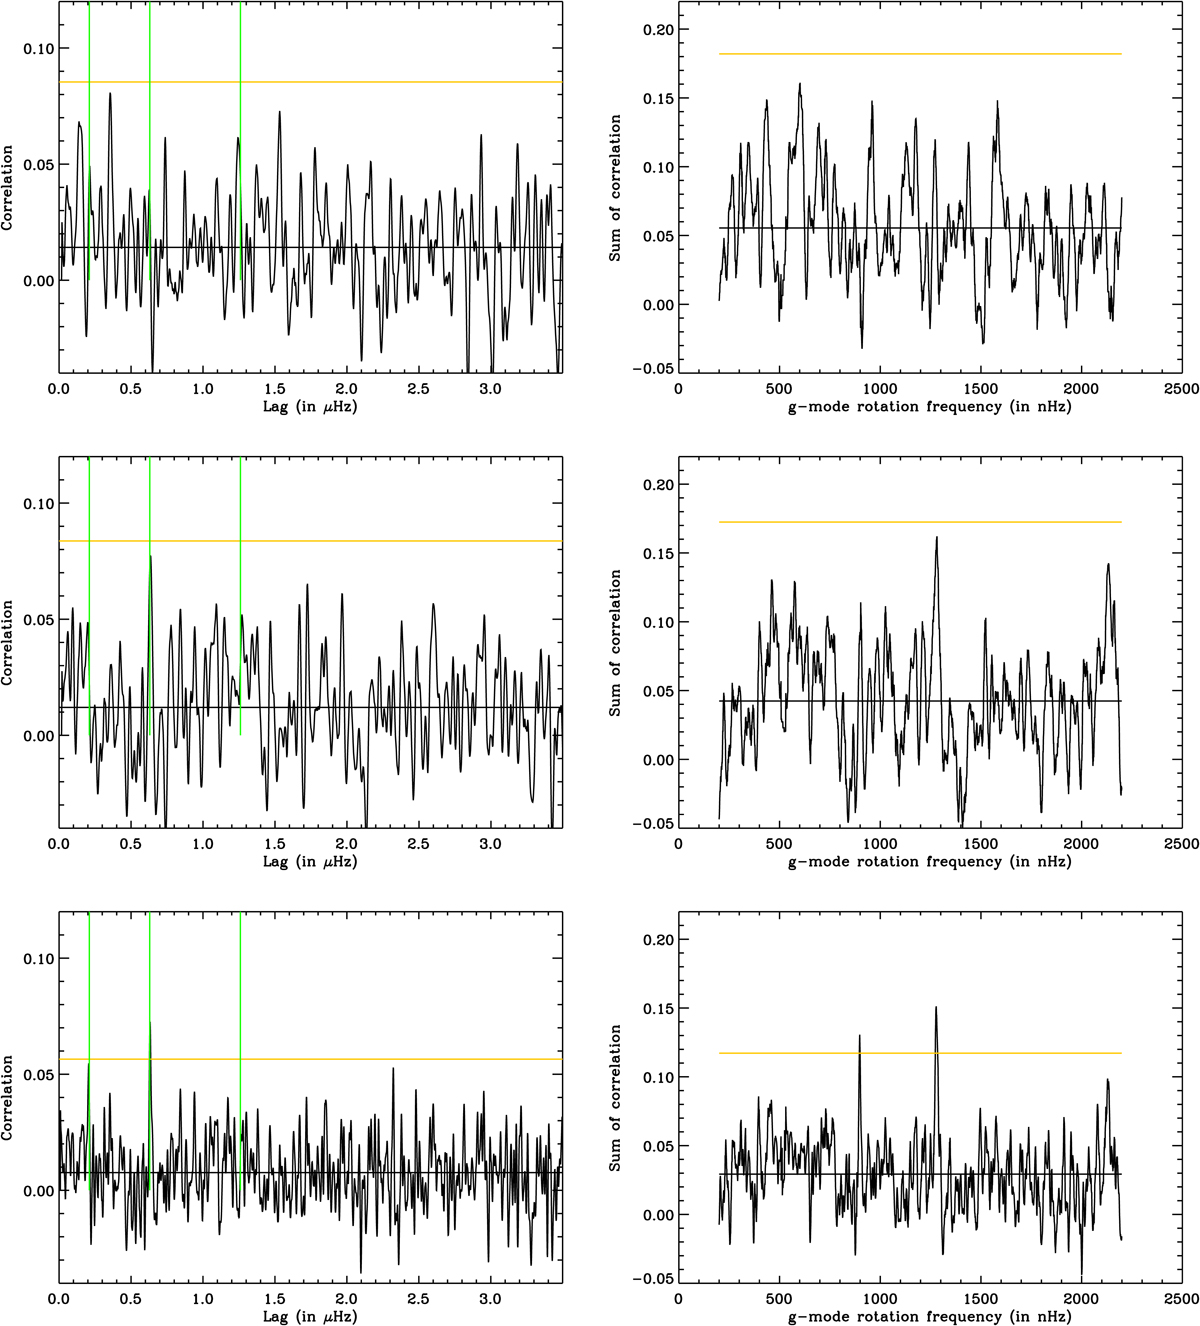
Left panel: correlation of the power spectrum as obtained by Fossat et al. (2017) as a function of frequency lag for three different time series of the average of photomultipliers PM1 and PM2 of GOLF sampled at 80 s for an observation time of 11 years starting April 1st 1996 (top), for an observation of 11 years starting April 1st 2007 (middle) and an observation time of 22 years (bottom). The green vertical lines correspond to frequencies at 210 nHz, 630 nHz and 1260 nHz. The black line indicates the mean value, while the orange line indicates the 10% probability level that there is at least one peak due to noise in the window; the level is 3.29σ for 11 years, and 3.48σ for 22 years. Right panel: sum of the correlation for l = 1, and l = 2 modes as obtained by Fossat et al. (2017) as a function of rotation frequency three different time series of the average of photomultipliers PM1 and PM2 of GOLF sampled at 80 s for an observation time of 11 years starting April 1st 1996 (top), for an observation of 11 years starting April 1st 2007 (middle) and an observation time of 22 years (bottom). The black line indicates the mean value, while the orange line indicates the 10% probability level that there is at least one peak due to noise in the window; the level is 3.4σ
Current usage metrics show cumulative count of Article Views (full-text article views including HTML views, PDF and ePub downloads, according to the available data) and Abstracts Views on Vision4Press platform.
Data correspond to usage on the plateform after 2015. The current usage metrics is available 48-96 hours after online publication and is updated daily on week days.
Initial download of the metrics may take a while.