Fig. 1.
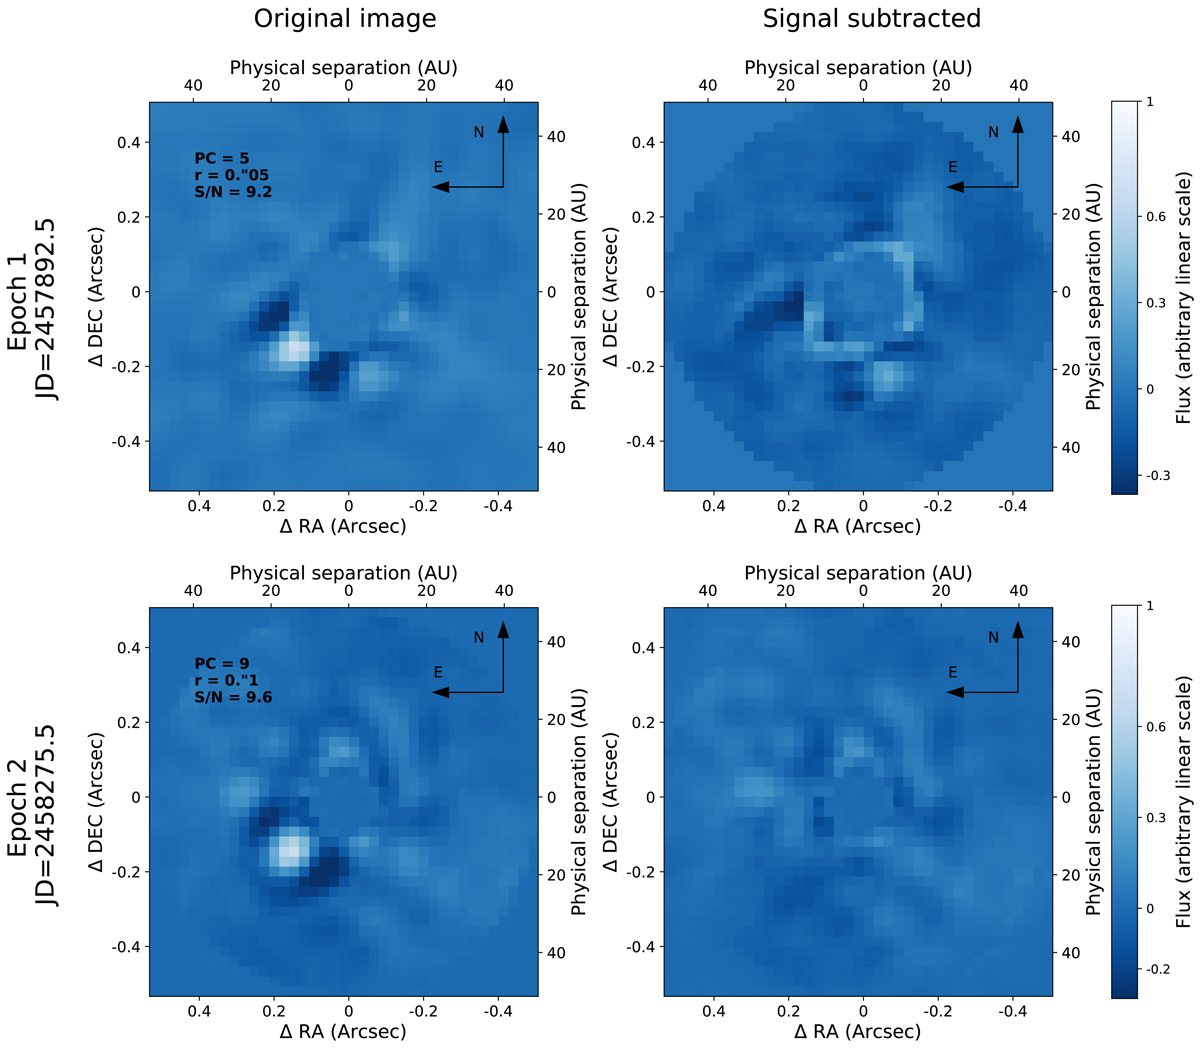
Left panel: first and second epoch detections (top and bottom panels, respectively) with the highest S/N (left panel) and the corresponding signal-subtracted images (right panel). The numbers of subtracted PCs from the central PSF, the applied mask radius, and the S/N are reported in the top left corner of the original images. The same parameters were used for the right panels, where prior to PSF subtraction the HM approach was used to subtract the companion signal.
Current usage metrics show cumulative count of Article Views (full-text article views including HTML views, PDF and ePub downloads, according to the available data) and Abstracts Views on Vision4Press platform.
Data correspond to usage on the plateform after 2015. The current usage metrics is available 48-96 hours after online publication and is updated daily on week days.
Initial download of the metrics may take a while.