Fig. 9.
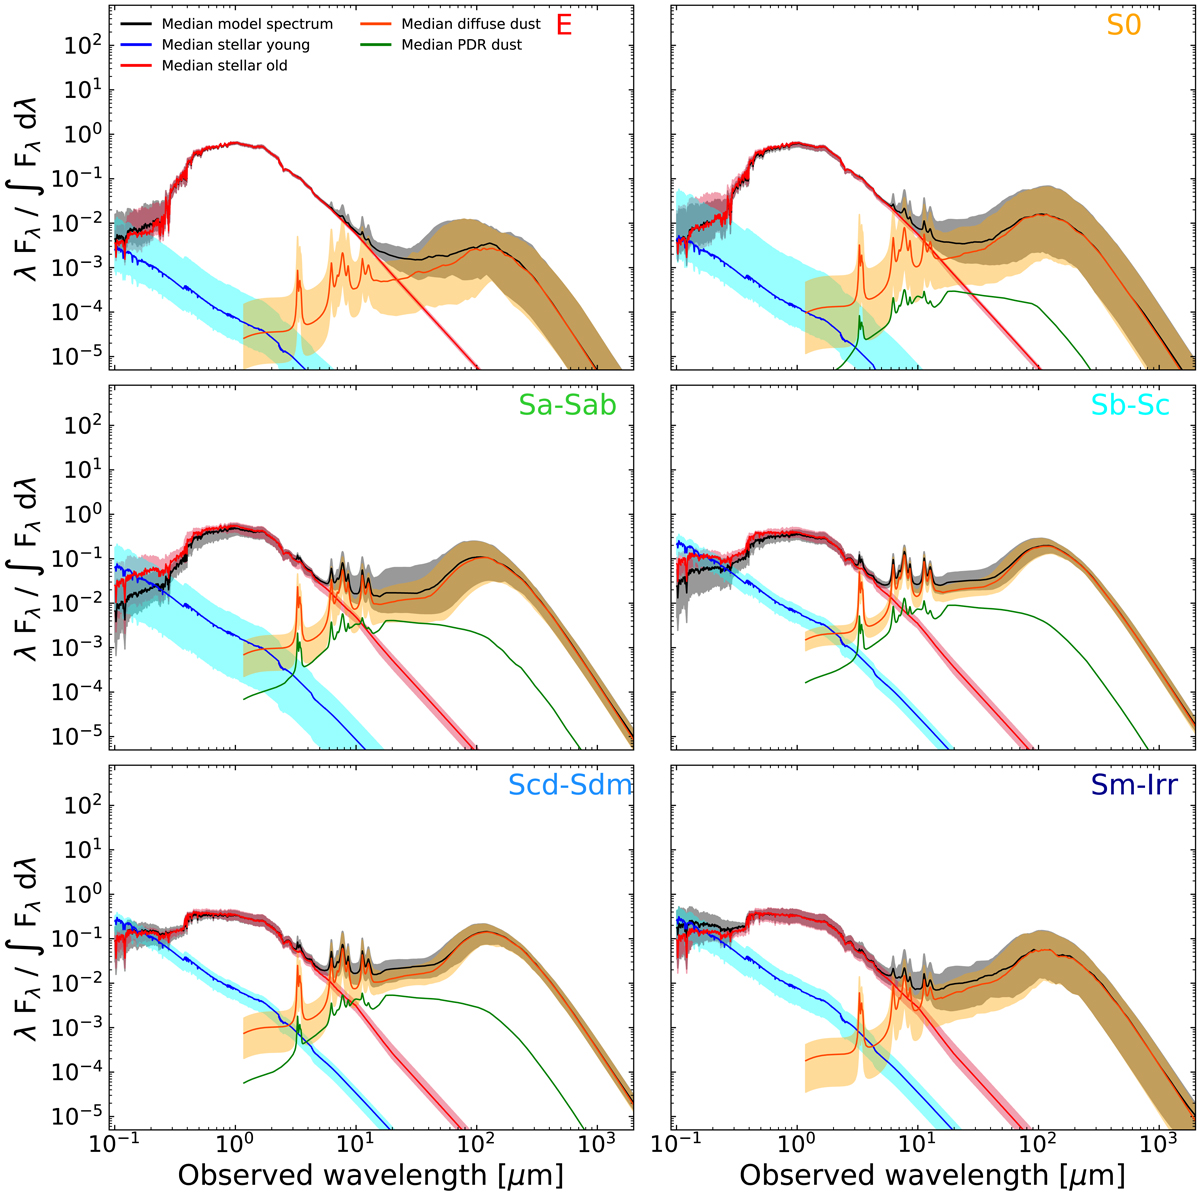
Template SEDs for the six main morphological classes as derived by CIGALE. The median SED of each sub-class is shown as a black curve while the unattenuated SEDs of the old and the young stars are shown as red and blue curves, respectively. The orange curve indicates the median spectrum of the diffuse dust, while the green curve shows the emission from PDRs. The shaded areas represent the range of the 16–84th percentiles to the median value (except for the case of the PDR spectra, where for clarity we refrain from presenting the full range of SEDs). For each subsample, the 10% most deviant SEDs have been excluded (see also the template SEDs presented in Bianchi et al. 2018).
Current usage metrics show cumulative count of Article Views (full-text article views including HTML views, PDF and ePub downloads, according to the available data) and Abstracts Views on Vision4Press platform.
Data correspond to usage on the plateform after 2015. The current usage metrics is available 48-96 hours after online publication and is updated daily on week days.
Initial download of the metrics may take a while.