Fig. 8.
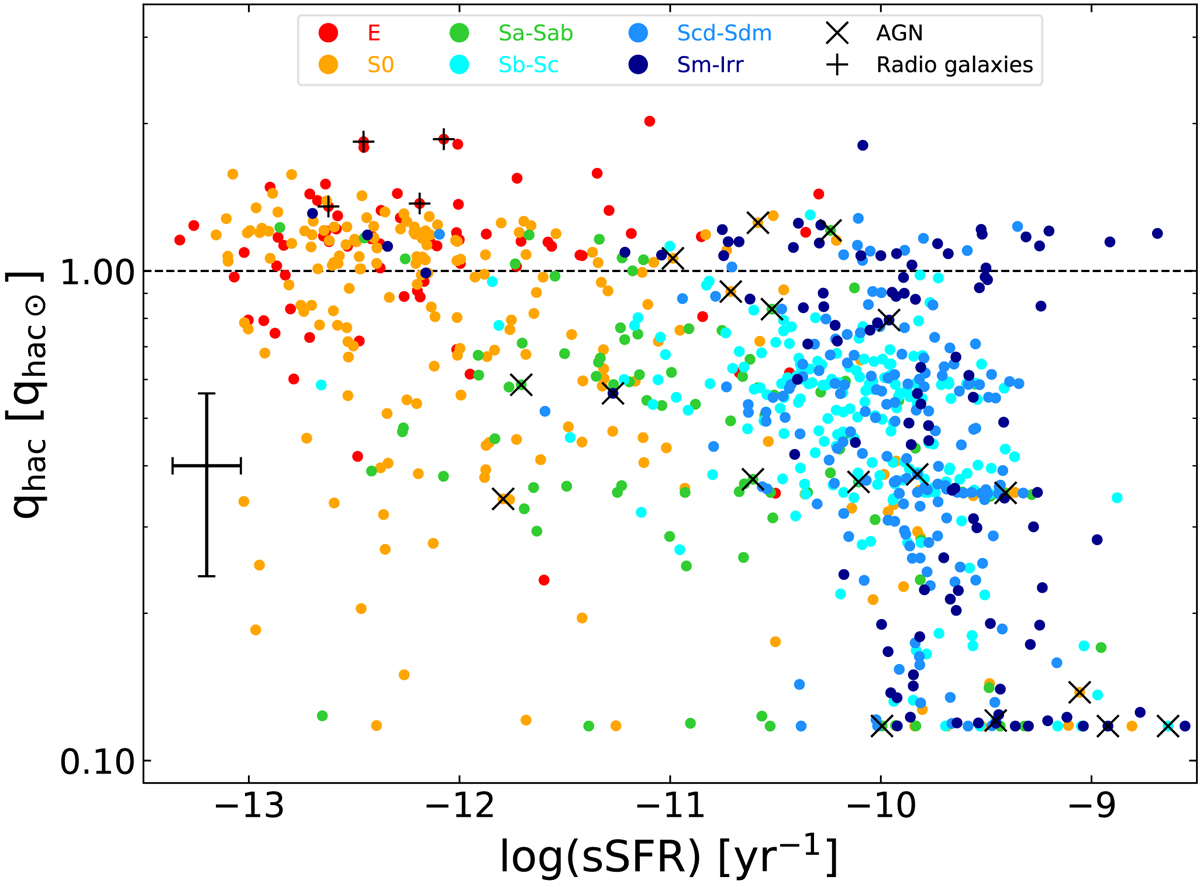
The small a-C(:H) mass fraction (qhac) as a function of sSFR. The parameter qhac is expressed in units of qhac⊙, qhac⊙ = 17%. Each point represents a galaxy and is color-coded according to morphology type, while galaxies hosting AGNs or strong radio-jets are indicated with an “X” or a “+”, respectively. The large cross is the typical uncertainty on the data.
Current usage metrics show cumulative count of Article Views (full-text article views including HTML views, PDF and ePub downloads, according to the available data) and Abstracts Views on Vision4Press platform.
Data correspond to usage on the plateform after 2015. The current usage metrics is available 48-96 hours after online publication and is updated daily on week days.
Initial download of the metrics may take a while.