Fig. 7.
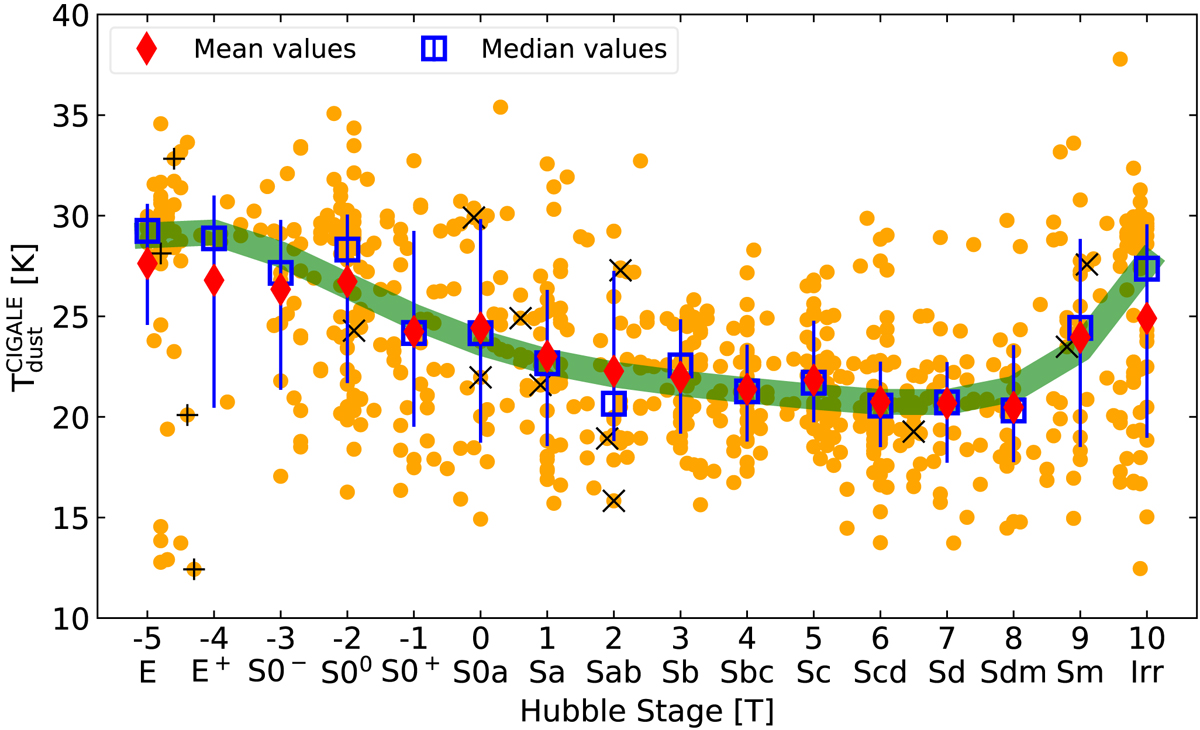
Dust temperature for galaxies of different Hubble stages, as derived from CIGALE. Orange circles are individual galaxies, red diamonds are the mean values for each morphological bin, while blue open squares are the median values. Error bars bracket the range between the 16th and 84th percentiles from the median. The thick green curve is a fifth-order polynomial regression to the median values (see Table D.1). The “+” and “X” symbols indicate strong radio jet galaxies and AGNs respectively.
Current usage metrics show cumulative count of Article Views (full-text article views including HTML views, PDF and ePub downloads, according to the available data) and Abstracts Views on Vision4Press platform.
Data correspond to usage on the plateform after 2015. The current usage metrics is available 48-96 hours after online publication and is updated daily on week days.
Initial download of the metrics may take a while.