Fig. 6.
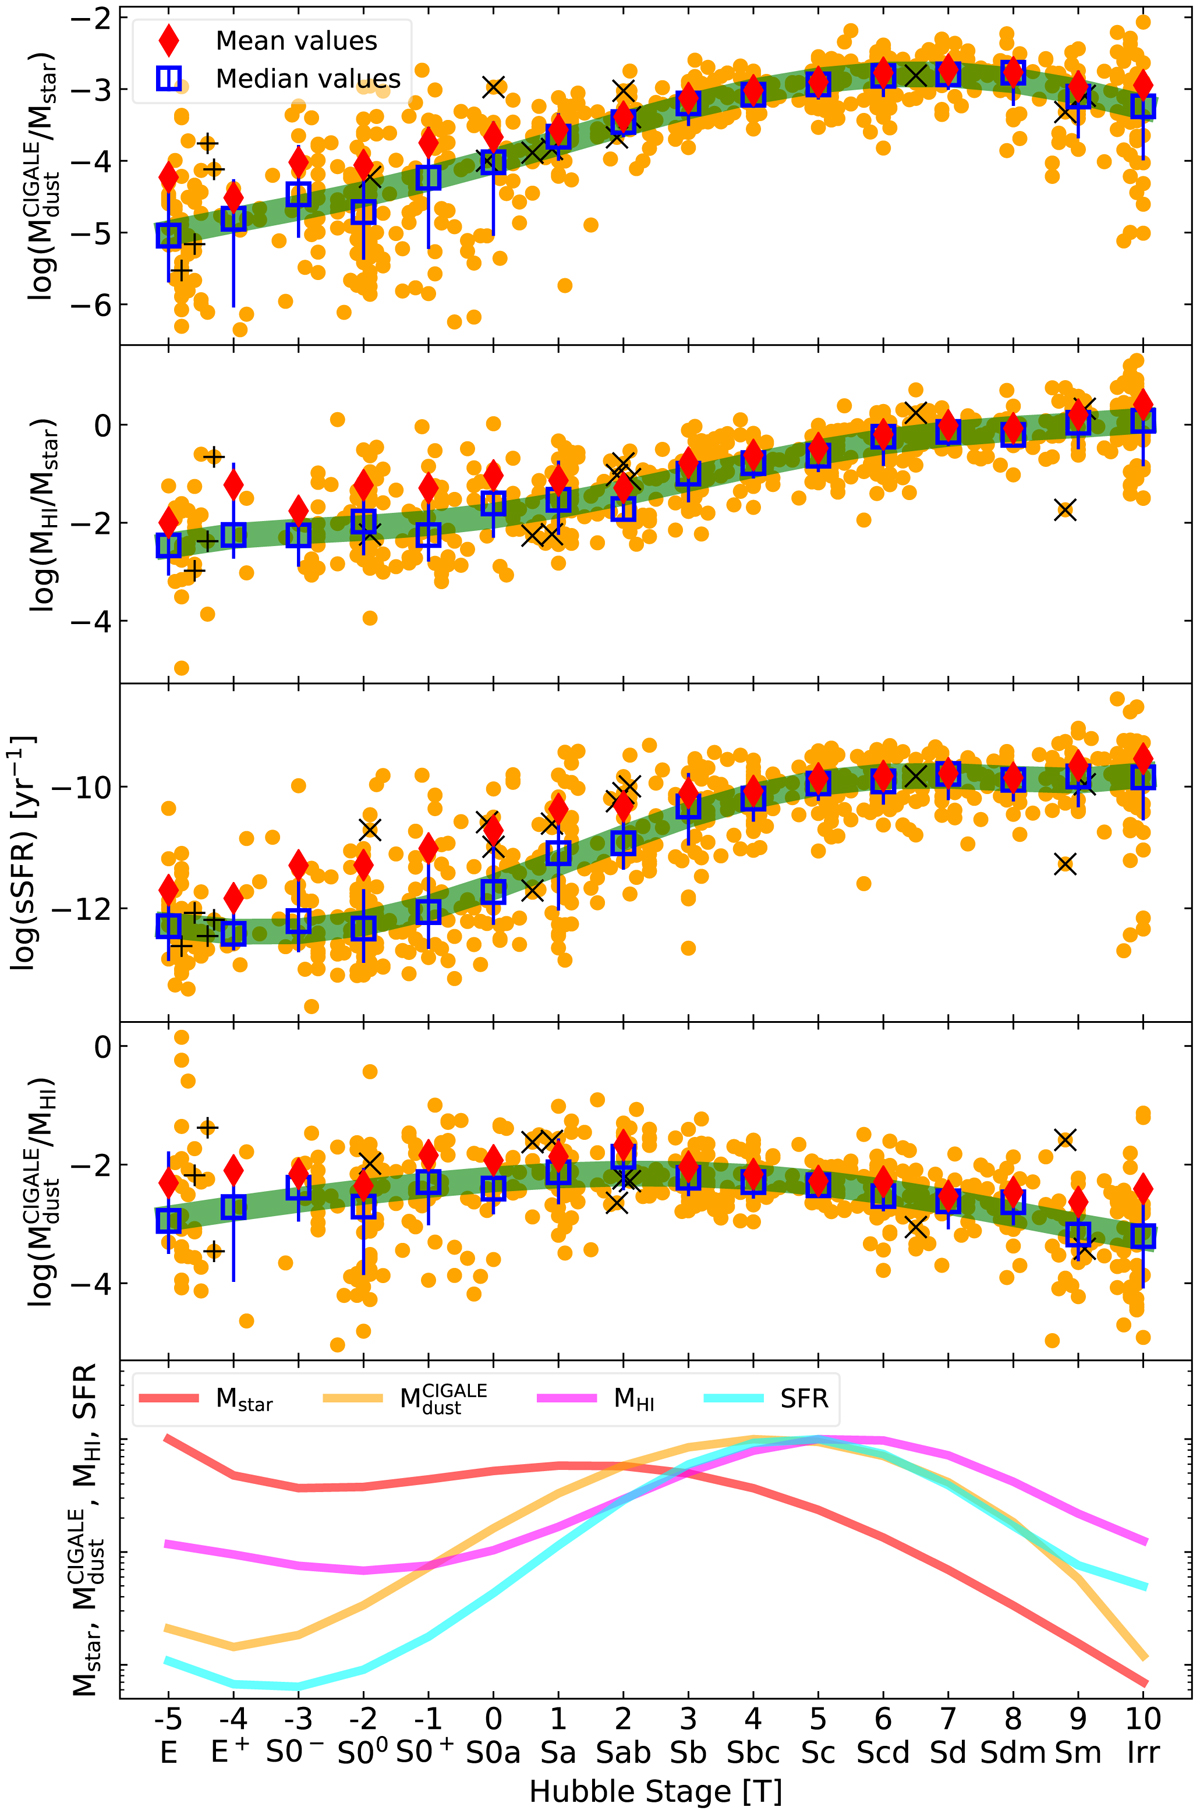
From top to bottom (first four panels): ![]() , sSFR and
, sSFR and ![]() as a function of Hubble stages (T). In each panel orange circles are individual galaxies, red diamonds are the mean values for each morphological bin, while blue squares are the median values. Error bars bracket the range between the 16th and 84th percentiles from the median. The thick green curves are fifth-order polynomial regressions to the median values (see Table D.1 for the polynomial regression parameters). In each of these panels “+” and “X” symbols indicate strong radio jet galaxies and AGNs, respectively. The last panel shows the variation in Mstar,
as a function of Hubble stages (T). In each panel orange circles are individual galaxies, red diamonds are the mean values for each morphological bin, while blue squares are the median values. Error bars bracket the range between the 16th and 84th percentiles from the median. The thick green curves are fifth-order polynomial regressions to the median values (see Table D.1 for the polynomial regression parameters). In each of these panels “+” and “X” symbols indicate strong radio jet galaxies and AGNs, respectively. The last panel shows the variation in Mstar, ![]() , MHI, and SFR (red, orange, magenta, and cyan lines respectively) with morphology as being fitted with a fifth-order polynomial regression through the median values (see Table D.1). Mstar,
, MHI, and SFR (red, orange, magenta, and cyan lines respectively) with morphology as being fitted with a fifth-order polynomial regression through the median values (see Table D.1). Mstar, ![]() , MHI, and SFR have been normalized to the maximum value obtained from each polynomial regression by: 3.9 × 10¹⁰ M⊙, 1.2 × 10⁷ M⊙, 2.6 × 10⁹ M⊙ and 1.08 M⊙ yr−1, respectively.
, MHI, and SFR have been normalized to the maximum value obtained from each polynomial regression by: 3.9 × 10¹⁰ M⊙, 1.2 × 10⁷ M⊙, 2.6 × 10⁹ M⊙ and 1.08 M⊙ yr−1, respectively.
Current usage metrics show cumulative count of Article Views (full-text article views including HTML views, PDF and ePub downloads, according to the available data) and Abstracts Views on Vision4Press platform.
Data correspond to usage on the plateform after 2015. The current usage metrics is available 48-96 hours after online publication and is updated daily on week days.
Initial download of the metrics may take a while.