Fig. 5.
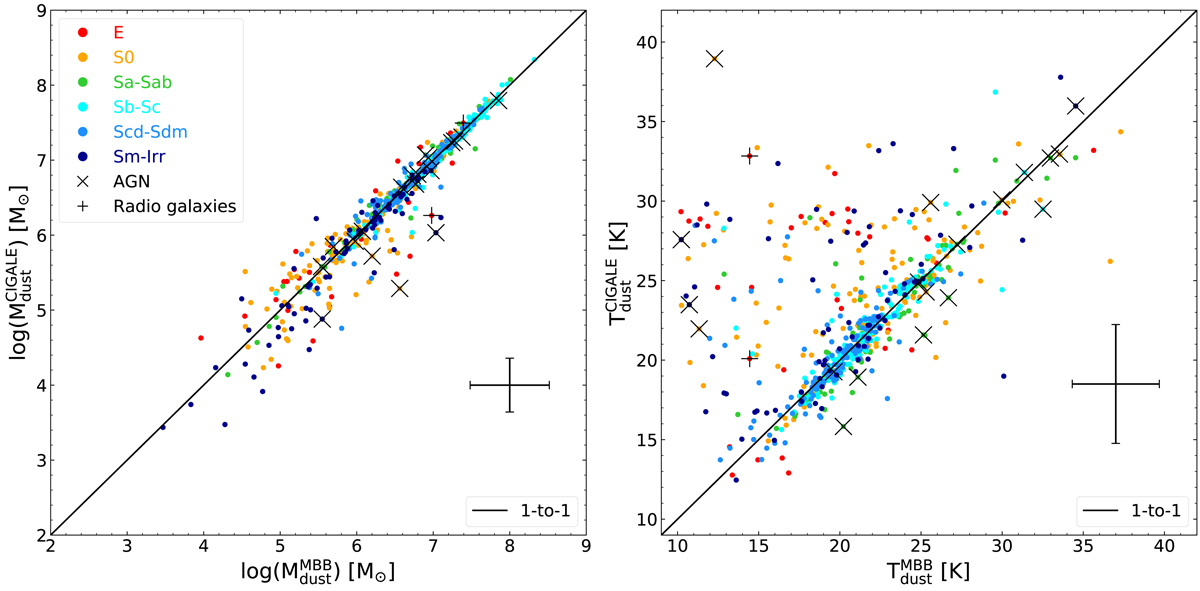
Comparison of Mdust (left panel) and Tdust (right panel), as derived from CIGALE (y-axis) and MBB (x-axis) modeling. The points are color-coded according to the morphological type, while “+” and “X” symbols indicate strong radio jet galaxies and AGNs, respectively (see the inset in the left panel for the explanation of the different colors and symbols). The solid black line indicates the one-to-one relation. The average uncertainty is indicated in the lower-right corner of each plot.
Current usage metrics show cumulative count of Article Views (full-text article views including HTML views, PDF and ePub downloads, according to the available data) and Abstracts Views on Vision4Press platform.
Data correspond to usage on the plateform after 2015. The current usage metrics is available 48-96 hours after online publication and is updated daily on week days.
Initial download of the metrics may take a while.